

Question: Using the data above, which should be in a file, the program would prompt the user for a file name and would read it and
Using the data above, which should be in a file, the program would prompt the user for a file name and would read it and output it, and then ask further questions provided in the sample output photo.
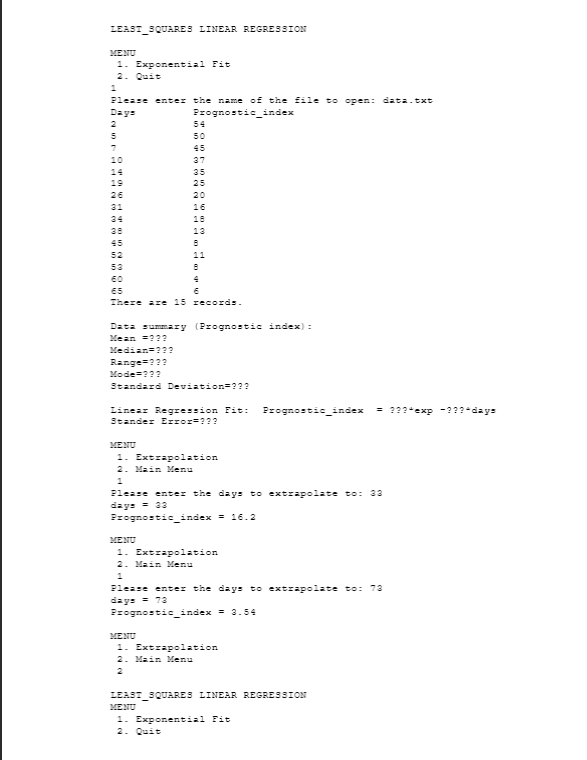
Sample Output:
If this could be done in either C/C++ that'd be great.
Thanks
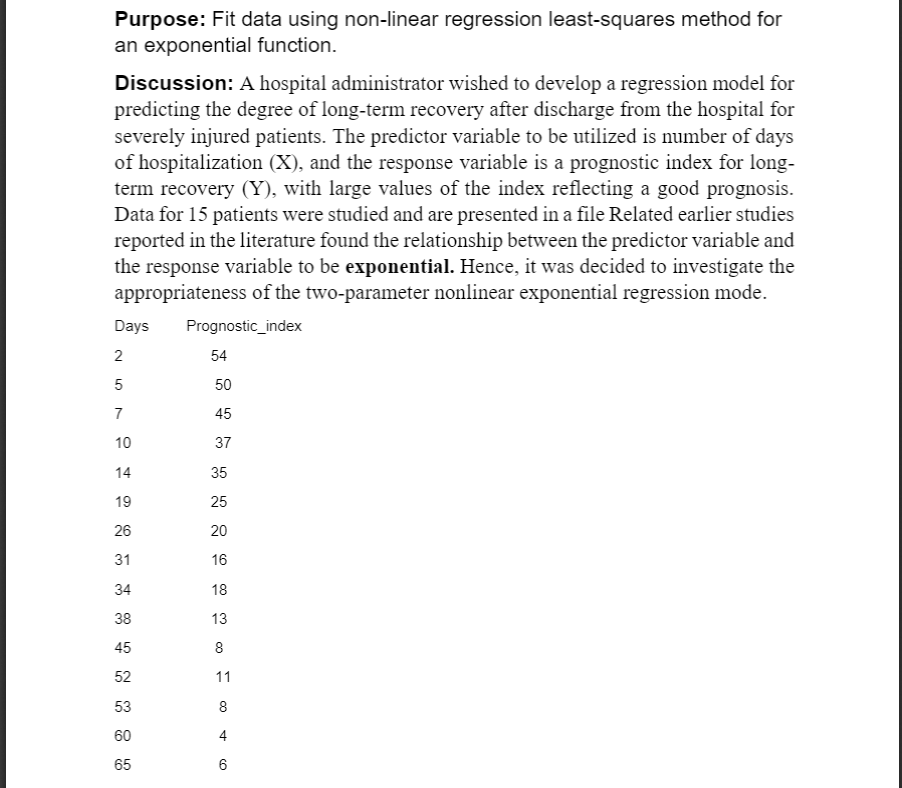
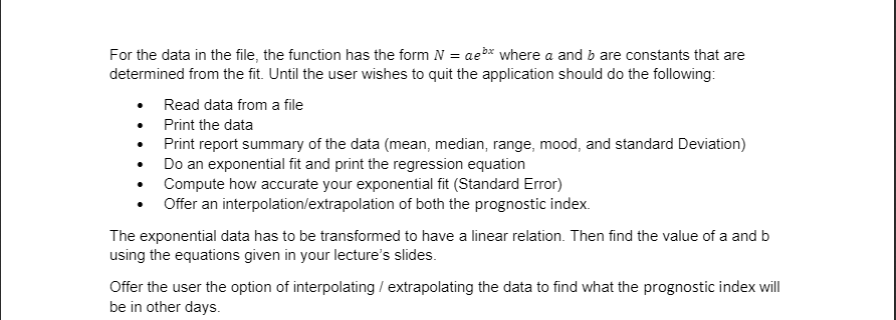
Purpose: Fit data using non-linear regression least-squares method for an exponential function. Discussion: A hospital administrator wished to develop a regression model for predicting the degree of long-term recovery after discharge from the hospital for severely injured patients. The predictor variable to be utilized is number of days of hospitalization (X), and the response variable is a prognostic index for long- term recovery (Y), with large values of the index reflecting a good prognosis. Data for 15 patients were studied and are presented in a file Related earlier studies reported in the literature found the relationship between the predictor variable and the response variable to be exponential. Hence, it was decided to investigate the appropriateness of the two-parameter nonlinear exponential regression mode. Days Prognostic_index 2 54 5 50 7 45 10 37 14 35 25 19 26 20 16 31 34 18 38 13 45 8 52 11 53 8 60 4 65 6 For the data in the file, the function has the form N = aebx where a and b are constants that are determined from the fit. Until the user wishes to quit the application should do the following: Read data from a file Print the data Print report summary of the data (mean, median, range, mood, and standard Deviation) Do an exponential fit and print the regression equation Compute how accurate your exponential fit (Standard Error) Offer an interpolation/extrapolation of both the prognostic index The exponential data has to be transformed to have a linear relation. Then find the value of a and b using the equations given in your lecture's slides. Offer the user the option of interpolating / extrapolating the data to find what the prognostic index will be in other days. LEAST_SQUARES LINEAR REGRESSION MENU 1. Exponential Fit Please enter the name of the sale to open: data.txt Day: Prognostic_index 50 19 16 13 8 11 60 65 There are 15 records. Data summary (Prognostic index): Median=322 Range=??? Mode=??? Standard Deviation=??? Linea: Regression Fit: Stander Error=??? Prognostic_index = ??? -exp -???-day: MENU 1. Extrapolation 2. Main Menu Please enter the days to extrapolate to: 33 day. = 33 Prognostic_index = 16.2 MENU 1. Extrapolation 2. Main Menu Please enter the days to extrapolate to: 73 day. = 72 Prognostic index = 3.54 MENU 1. Extrapolation 2. Main Menu LEAST_SQUARES LINEAR REGRESSION MENU 1. Exponential Fit 2. Quit Purpose: Fit data using non-linear regression least-squares method for an exponential function. Discussion: A hospital administrator wished to develop a regression model for predicting the degree of long-term recovery after discharge from the hospital for severely injured patients. The predictor variable to be utilized is number of days of hospitalization (X), and the response variable is a prognostic index for long- term recovery (Y), with large values of the index reflecting a good prognosis. Data for 15 patients were studied and are presented in a file Related earlier studies reported in the literature found the relationship between the predictor variable and the response variable to be exponential. Hence, it was decided to investigate the appropriateness of the two-parameter nonlinear exponential regression mode. Days Prognostic_index 2 54 5 50 7 45 10 37 14 35 25 19 26 20 16 31 34 18 38 13 45 8 52 11 53 8 60 4 65 6 For the data in the file, the function has the form N = aebx where a and b are constants that are determined from the fit. Until the user wishes to quit the application should do the following: Read data from a file Print the data Print report summary of the data (mean, median, range, mood, and standard Deviation) Do an exponential fit and print the regression equation Compute how accurate your exponential fit (Standard Error) Offer an interpolation/extrapolation of both the prognostic index The exponential data has to be transformed to have a linear relation. Then find the value of a and b using the equations given in your lecture's slides. Offer the user the option of interpolating / extrapolating the data to find what the prognostic index will be in other days. LEAST_SQUARES LINEAR REGRESSION MENU 1. Exponential Fit Please enter the name of the sale to open: data.txt Day: Prognostic_index 50 19 16 13 8 11 60 65 There are 15 records. Data summary (Prognostic index): Median=322 Range=??? Mode=??? Standard Deviation=??? Linea: Regression Fit: Stander Error=??? Prognostic_index = ??? -exp -???-day: MENU 1. Extrapolation 2. Main Menu Please enter the days to extrapolate to: 33 day. = 33 Prognostic_index = 16.2 MENU 1. Extrapolation 2. Main Menu Please enter the days to extrapolate to: 73 day. = 72 Prognostic index = 3.54 MENU 1. Extrapolation 2. Main Menu LEAST_SQUARES LINEAR REGRESSION MENU 1. Exponential Fit 2. Quit
Step by Step Solution
There are 3 Steps involved in it

Get step-by-step solutions from verified subject matter experts