

Question: Using the Data Analysis tool for Histograms select Chart and Cumulative Output Options. If you use the Pivot Tool you will need to complete the
- Using the Data Analysis tool for Histograms select Chart and Cumulative Output Options. If you use the Pivot Tool you will need to complete the Frequency Distribution table by adding a Cumulative column
- Make sure you use the same range/interval for both exams. (Use the same Bin table (best) if using the data Analysis tool or the same grouping if using the Pivot Tool.
- Review the output and prepare your answers - What information will you present to the team? (Can use Insert text box on the spread sheet)
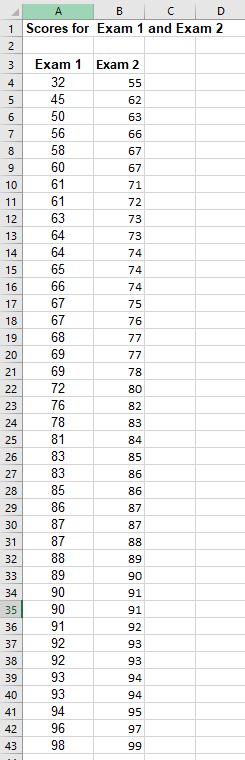
\begin{tabular}{|c|c|r|r|r|} \hline 4 & A & \multicolumn{1}{|c|}{ B } & C \\ \hline 1 & Scores for & Exam 1 and Exam 2 \\ \hline 2 & & & \\ \hline 3 & Exam 1 & Exam 2 & & \\ \hline 4 & 32 & 55 & \\ \hline 5 & 45 & 62 & \\ \hline 6 & 50 & 63 & \\ \hline 7 & 56 & 66 & \\ \hline 8 & 58 & 67 & \\ \hline 9 & 60 & 67 & \\ \hline 10 & 61 & 71 & \\ \hline 11 & 61 & 72 & \\ \hline 12 & 63 & 73 & \\ \hline 13 & 64 & 73 & \\ \hline 14 & 64 & 74 & \\ \hline 15 & 65 & 74 & \\ \hline 16 & 66 & 74 & \\ \hline 17 & 67 & 75 & \\ \hline 18 & 67 & 76 & \\ \hline 19 & 68 & 77 & \\ \hline 20 & 69 & 77 & \\ \hline 21 & 69 & 78 & \\ \hline 22 & 72 & 80 & \\ \hline 23 & 76 & 82 & \\ \hline 24 & 78 & 83 & \\ \hline 25 & 81 & 84 & \\ \hline 26 & 83 & 85 & \\ \hline 27 & 83 & 86 & \\ \hline 28 & 85 & 86 & \\ \hline 39 & 86 & 87 & \\ \hline 30 & 87 & 87 & \\ \hline 31 & 87 & 88 & \\ \hline 32 & 88 & 89 & \\ \hline 33 & 89 & 90 & \\ \hline 34 & 90 & 91 & \\ \hline 35 & 90 & 91 & \\ \hline 36 & 91 & 92 & \\ \hline 37 & 92 & 93 & \\ \hline 39 & 93 & 93 & \\ \hline \end{tabular}
Step by Step Solution
There are 3 Steps involved in it

Get step-by-step solutions from verified subject matter experts