

Question: Using the data analysis tool R Extra Credit Assignment: please show your code as well as output in a word file and submit through Moodle.
Using the data analysis tool R
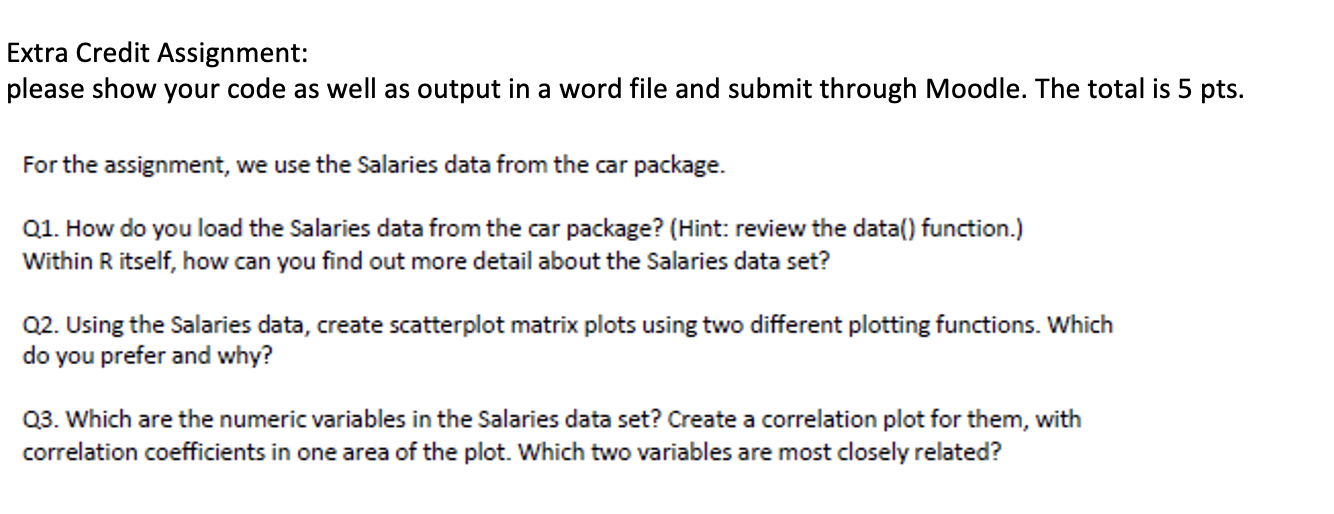
Extra Credit Assignment: please show your code as well as output in a word file and submit through Moodle. The total is 5 pts. For the assignment, we use the Salaries data from the car package. 01. How do you load the Salaries data from the car package? (Hint: review the data() function.) Within itself, how can you find out more detail about the Salaries data set? 02. Using the Salaries data, create scatterplot matrix plots using two different plotting functions. Which do you prefer and why? Q3. Which are the numeric variables in the Salaries data set? Create a correlation plot for them, with correlation coefficients in one area of the plot. Which two variables are most closely related? Extra Credit Assignment: please show your code as well as output in a word file and submit through Moodle. The total is 5 pts. For the assignment, we use the Salaries data from the car package. 01. How do you load the Salaries data from the car package? (Hint: review the data() function.) Within itself, how can you find out more detail about the Salaries data set? 02. Using the Salaries data, create scatterplot matrix plots using two different plotting functions. Which do you prefer and why? Q3. Which are the numeric variables in the Salaries data set? Create a correlation plot for them, with correlation coefficients in one area of the plot. Which two variables are most closely related
Step by Step Solution
There are 3 Steps involved in it

Get step-by-step solutions from verified subject matter experts