

Question: Using the data below, what happened to the shape of the yield curve between these two dates? How do you know? Jan. Jan. Security 15,
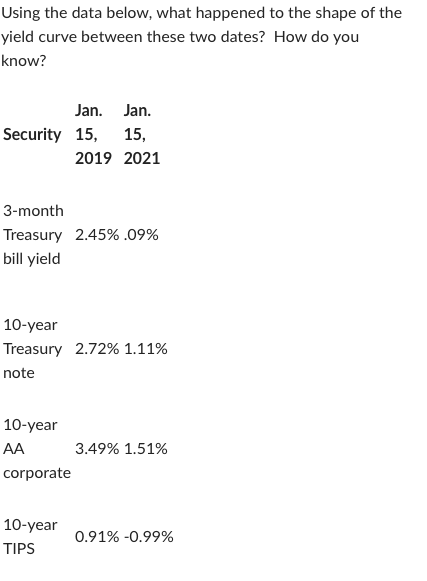
Using the data below, what happened to the shape of the yield curve between these two dates? How do you know? Jan. Jan. Security 15, 15, 2019 2021 3-month Treasury 2.45%.09% bill yield 10-year Treasury 2.72% 1.11% note 10-year 3.49% 1.51% corporate 10-year TIPS 0.91% -0.99% Using the data below, what happened to the shape of the yield curve between these two dates? How do you know? Jan. Jan. Security 15, 15, 2019 2021 3-month Treasury 2.45%.09% bill yield 10-year Treasury 2.72% 1.11% note 10-year 3.49% 1.51% corporate 10-year TIPS 0.91% -0.99%
Step by Step Solution
There are 3 Steps involved in it
1 Expert Approved Answer
Step: 1 Unlock

Question Has Been Solved by an Expert!
Get step-by-step solutions from verified subject matter experts
Step: 2 Unlock
Step: 3 Unlock