

Question: Using the data for Brady and Co. provided in the sheet labeled Trial Balance prepare: Balance Sheet - comparative, classified in proper format for fiscal
| Using the data for Brady and Co. provided in the sheet labeled "Trial Balance" prepare: | ||||||||||
| Balance Sheet - comparative, classified in proper format for fiscal years 2015 and 2016 | ||||||||||
| Income Statement - multiple-step for fiscal years 2015 and 2016. Include earnings per share data. | ||||||||||
| Statement of Retained Earnings for 2016. | ||||||||||
| Use separate sheets, appropriately named, for each financial statement in good form. | ||||||||||
| List 5 notes that would be required if you were also preparing the notes to these financial statements. | ||||||||||
| Do not prepare the notes, just briefly list the accounts, etc. for which GAAP would require disclosure | ||||||||||
| based on Brady's financial statements. | ||||||||||
PLEASE HELP. I have a teacher who teaches us nothing and I've been struggling to figure out how to complete the statements with the book for weeks. I'm also confused on how I'm suppossed to include earnings per share on the income statement. I posted the trial balance once above and once below in case it helps
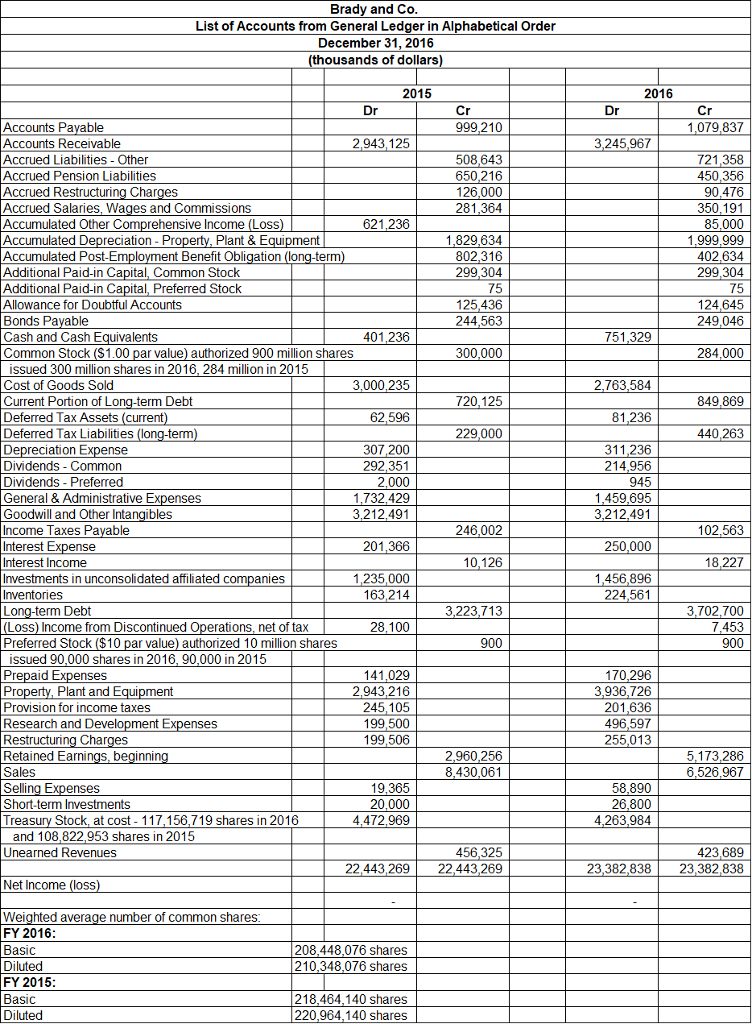
| Brady and Co. | ||||||
| List of Accounts from General Ledger in Alphabetical Order | ||||||
| December 31, 2016 | ||||||
| (thousands of dollars) | ||||||
| 2015 | 2016 | |||||
| Dr | Cr | Dr | Cr | |||
| Accounts Payable | 999,210 | 1,079,837 | ||||
| Accounts Receivable | 2,943,125 | 3,245,967 | ||||
| Accrued Liabilities - Other | 508,643 | 721,358 | ||||
| Accrued Pension Liabilities | 650,216 | 450,356 | ||||
| Accrued Restructuring Charges | 126,000 | 90,476 | ||||
| Accrued Salaries, Wages and Commissions | 281,364 | 350,191 | ||||
| Accumulated Other Comprehensive Income (Loss) | 621,236 | 85,000 | ||||
| Accumulated Depreciation - Property, Plant & Equipment | 1,829,634 | 1,999,999 | ||||
| Accumulated Post-Employment Benefit Obligation (long-term) | 802,316 | 402,634 | ||||
| Additional Paid-in Capital, Common Stock | 299,304 | 299,304 | ||||
| Additional Paid-in Capital, Preferred Stock | 75 | 75 | ||||
| Allowance for Doubtful Accounts | 125,436 | 124,645 | ||||
| Bonds Payable | 244,563 | 249,046 | ||||
| Cash and Cash Equivalents | 401,236 | 751,329 | ||||
| Common Stock ($1.00 par value) authorized 900 million shares | 300,000 | 284,000 | ||||
| issued 300 million shares in 2016, 284 million in 2015 | ||||||
| Cost of Goods Sold | 3,000,235 | 2,763,584 | ||||
| Current Portion of Long-term Debt | 720,125 | 849,869 | ||||
| Deferred Tax Assets (current) | 62,596 | 81,236 | ||||
| Deferred Tax Liabilities (long-term) | 229,000 | 440,263 | ||||
| Depreciation Expense | 307,200 | 311,236 | ||||
| Dividends - Common | 292,351 | 214,956 | ||||
| Dividends - Preferred | 2,000 | 945 | ||||
| General & Administrative Expenses | 1,732,429 | 1,459,695 | ||||
| Goodwill and Other Intangibles | 3,212,491 | 3,212,491 | ||||
| Income Taxes Payable | 246,002 | 102,563 | ||||
| Interest Expense | 201,366 | 250,000 | ||||
| Interest Income | 10,126 | 18,227 | ||||
| Investments in unconsolidated affiliated companies | 1,235,000 | 1,456,896 | ||||
| Inventories | 163,214 | 224,561 | ||||
| Long-term Debt | 3,223,713 | 3,702,700 | ||||
| (Loss) Income from Discontinued Operations, net of tax | 28,100 | 7,453 | ||||
| Preferred Stock ($10 par value) authorized 10 million shares | 900 | 900 | ||||
| issued 90,000 shares in 2016, 90,000 in 2015 | ||||||
| Prepaid Expenses | 141,029 | 170,296 | ||||
| Property, Plant and Equipment | 2,943,216 | 3,936,726 | ||||
| Provision for income taxes | 245,105 | 201,636 | ||||
| Research and Development Expenses | 199,500 | 496,597 | ||||
| Restructuring Charges | 199,506 | 255,013 | ||||
| Retained Earnings, beginning | 2,960,256 | 5,173,286 | ||||
| Sales | 8,430,061 | 6,526,967 | ||||
| Selling Expenses | 19,365 | 58,890 | ||||
| Short-term Investments | 20,000 | 26,800 | ||||
| Treasury Stock, at cost - 117,156,719 shares in 2016 | 4,472,969 | 4,263,984 | ||||
| and 108,822,953 shares in 2015 | ||||||
| Unearned Revenues | 456,325 | 423,689 | ||||
| 22,443,269 | 22,443,269 | 23,382,838 | 23,382,838 | |||
| Net Income (loss) | ||||||
| - | - | |||||
| Weighted average number of common shares: | ||||||
| FY 2016: | ||||||
| Basic | 208,448,076 shares | |||||
| Diluted | 210,348,076 shares | |||||
| FY 2015: | ||||||
| Basic | 218,464,140 shares | |||||
| Diluted | 220,964,140 shares | |||||
Brady and Co List of Accounts from General Ledger in Alphabetical Order December 31, 2016 (thousands of dollars) 15 Cr l13r Cr 210 1079 83 Accounts Pavable Accounts Receivable Accrued Liabilities Other Accrued Pension Liabilities Accrued Restructuring Chan 7 2943,125 3,245,967 721,358 650,216 Wages and Commissions 364 621,236 Accumulated Other Comprehensive Income (Loss Accumulated Depreciation Property, Plant & Equipment 802,316 402,634 Additional Paid-in Capital, Preferred Stock Allowance for Doubtful Accounts 244,563 249,046 401,236 Cash and Cash Equivalents Common Stock (S1.00 par value) authorized 900 million shares 284,000 issued 300 million shares in 2016, 284 million in 2015 Cost of Goods Sold 3,000,235 2,763,584 720,125 849869 Deferred Tax Assets (current 440,263 Depreciation Ex Dividends- Common Dividends Preferred se 292,351 1,732,429 3,212,491 1,459,695 3,212 491 Goodwill and Other Intangibles Income Taxes Pavable Interest Expense nterest Income Investments in unconsolidated affiliated companies nventories 246,002 102,563 1235,000 163,214 3,702,700 7,453 900 3,223,713 Preferred Stock ($10 par value) authorized 10 million shares 900 issued 90,000 shares in 2016, 90,000 in 2015 Property Plant and Equipment Provision for income taxes 2,943,216 245,105 3,936,726 496,597 255,013 Restructuring Char Ret ained Earnings, beginning 2,960,256 8,430,061 5,173,286 Short-term Investments Treasury Stock, at cost 117,156,719 shares in 2016 4,472,969 4,263,984 and 108,822,953 shares in 2015 456,325 22,443,269 22,443,269 423,689 23,382,838 23,382,838 Unearned Revenues Net Income (loss Weighted average number of common shares: FY 2016 08,448,076 shar 210,348,076 shares FY 2015 Basic 218,464,140 shares
Step by Step Solution
There are 3 Steps involved in it

Get step-by-step solutions from verified subject matter experts