

Question: Using the data for Johnson & Johnson (NYSE:JNJ), presented below: Johnson & Johnson Selected Financial Data For the Years 2014 to 2018 Fiscal Year
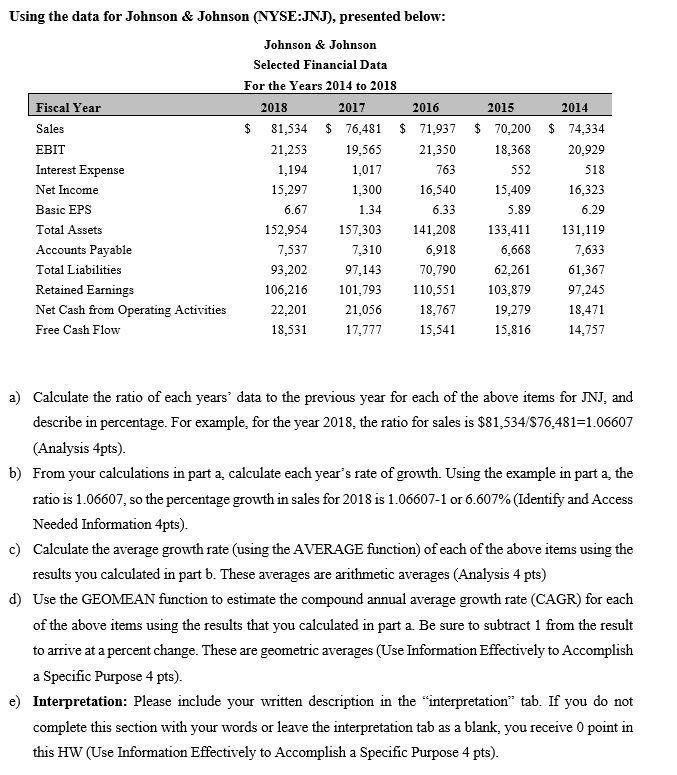
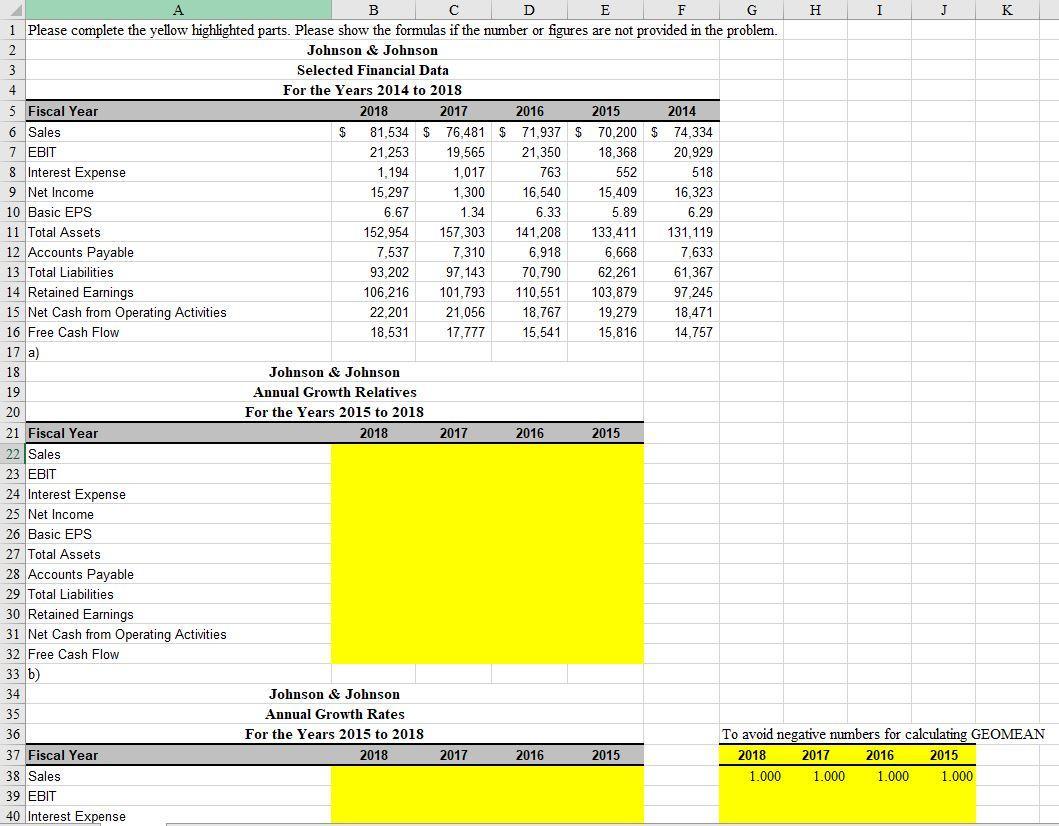
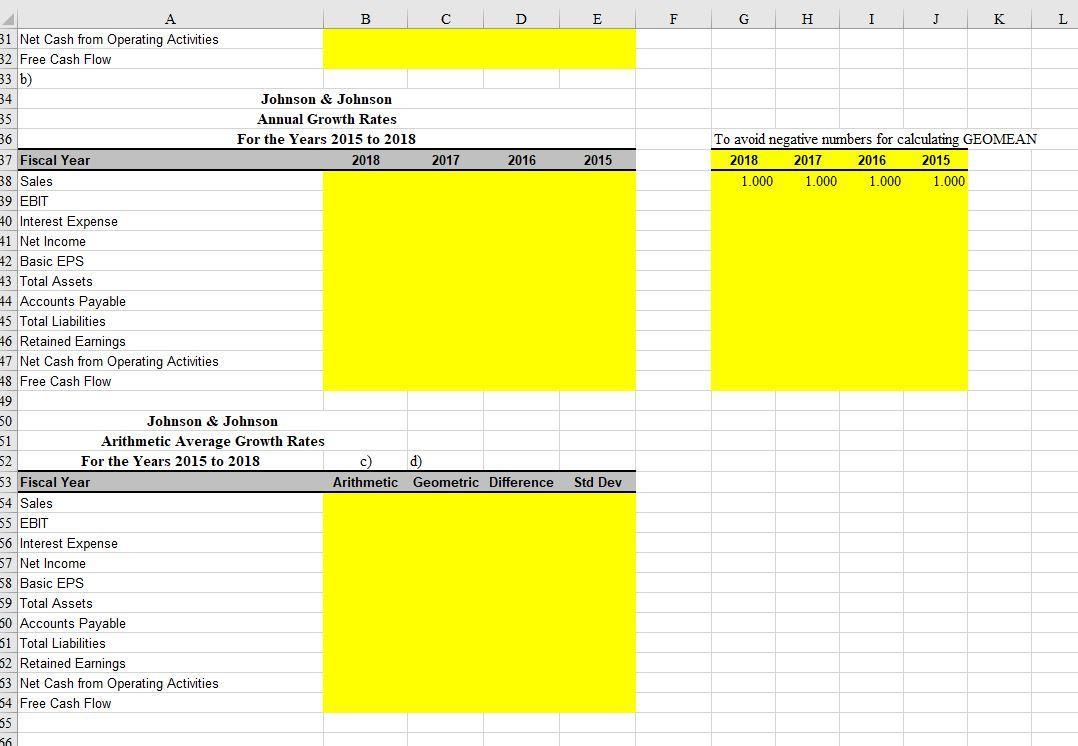
Using the data for Johnson & Johnson (NYSE:JNJ), presented below: Johnson & Johnson Selected Financial Data For the Years 2014 to 2018 Fiscal Year 2018 2017 2016 2015 2014 Sales $ 81,534 $ 76,481 $ 71,937 $ 70,200 $ 74,334 EBIT 21,253 19,565 21,350 18,368 20,929 Interest Expense 1,194 1,017 763 552 518 Net Income 15,297 1,300 16,540 15,409 16,323 Basic EPS 6.67 1.34 6.33 5.89 6.29 Total Assets 152,954 157,303 141,208 133,411 131,119 Accounts Payable 7,537 7,310 6,918 6,668 7,633 Total Liabilities 93,202 97,143 70,790 62,261 61,367 Retained Earnings 106,216 101,793 110,551 103,879 97,245 Net Cash from Operating Activities 22,201 21,056 18,767 19,279 18,471 Free Cash Flow 18,531 17,777 15,541 15,816 14,757 a) Calculate the ratio of each years' data to the previous year for each of the above items for JNJ, and describe in percentage. For example, for the year 2018, the ratio for sales is $81,534/S76,481=1.06607 (Analysis 4pts). b) From your calculations in part a, calculate each year's rate of growth. Using the example in part a, the ratio is 1.06607, so the percentage growth in sales for 2018 is 1.06607-1 or 6.607% (Identify and Access Needed Information 4pts). c) Calculate the average growth rate (using the AVERAGE function) of each of the above items using the results you calculated in part b. These averages are arithmetic averages (Analysis 4 pts) d) Use the GEOMEAN function to estimate the compound annual average growth rate (CAGR) for each of the above items using the results that you calculated in part a. Be sure to subtract 1 from the result to arrive at a percent change. These are geometric averages (Use Information Effectively to Accomplish a Specific Purpose 4 pts). e) Interpretation: Please include your written description in the "interpretation" tab. If you do not complete this section with your words or leave the interpretation tab as a blank, you receive 0 point in this HW (Use Information Effectively to Accomplish a Specific Purpose 4 pts). D A B E F G H I J K 1 Please complete the yellow highlighted parts. Please show the formulas if the number or figures are not provided in the problem. 2 Johnson & Johnson 3 Selected Financial Data 4 For the Years 2014 to 2018 5 Fiscal Year 2018 2017 2016 2015 2014 6 Sales 81,534 $ 76,481 $ 71,937 $ 70,200 $ 74,334 7 EBIT 8 Interest Expense 9 Net Income 10 Basic EPS 11 Total Assets 12 Accounts Payable 13 Total Liabilities 14 Retained Earnings 21,253 19,565 21,350 18,368 20,929 1,194 1,017 763 552 518 15,297 1,300 16,540 15,409 16,323 6.67 1.34 6.33 5.89 6.29 152,954 157,303 141.208 133,411 131,119 7,537 7,310 6,918 6,668 7,633 93,202 97,143 70.790 62,261 61,367 106,216 101,793 110,551 103,879 97,245 15 Net Cash from Operating Activities 22,201 21.056 18,767 19,279 18,471 16 Free Cash Flow 18,531 17,777 15,541 15,816 14.757 17 a) 18 Johnson & Johnson 19 Annual Growth Relatives 20 For the Years 2015 to 2018 21 Fiscal Year 2018 2017 2016 2015 22 Sales 23 EBIT 24 Interest Expense 25 Net Income 26 Basic EPS 27 Total Assets 28 Accounts Payable 29 Total Liabilities 30 Retained Earnings 31 Net Cash from Operating Activities 32 Free Cash Flow 33 b) 34 Johnson & Johnson 35 Annual Growth Rates 36 For the Years 2015 to 2018 To avoid negative numbers for calculating GEOMEAN 37 Fiscal Year 2018 2017 2016 2015 2018 2017 2016 2015 38 Sales 1.000 1.000 1.000 1.000 39 EBIT 40 Interest Expense A E F H I J K L 31 Net Cash from Operating Activities 32 Free Cash Flow 33 b) 34 35 36 Johnson & Johnson Annual Growth Rates For the Years 2015 to 2018 To avoid negative mumbers for calculating GEOMEAN 37 Fiscal Year 38 Sales 39 BIT 2018 2017 2016 2015 2018 2017 2016 2015 1.000 1.000 1.000 1.000 40 Interest Expense 41 Net Income 42 Basic EPS 43 Total Assets 44 Accounts Payable 45 Total Liabilities 46 Retained Earnings 47 Net Cash from Operating Activities 48 Free Cash Flow 49 50 51 Johnson & Johnson Arithmetic Average Growth Rates 52 For the Years 2015 to 2018 c) d) 53 Fiscal Year Arithmetic Geometric Difference Std Dev 54 Sales 55 EBIT 56 Interest Expense 57 Net Income 58 Basic EPS 59 Total Assets 30 Accounts Payable 51 Total Liabilities 52 Retained Earnings 33 Net Cash from Operating Activities 54 Free Cash Flow 35
Step by Step Solution
3.50 Rating (143 Votes )
There are 3 Steps involved in it
B C E F Computation of all the ratios A B E F 1 2018 2017 2016 ... View full answer

Get step-by-step solutions from verified subject matter experts