

Question: using the data for Operator B, Samples 4-6, make a more effective table. Some things worth considering are graph type (e.g. line, scatter, bar), units,
using the data for Operator B, Samples 4-6, make a more effective table. Some things worth considering are graph type (e.g. line, scatter, bar), units, axis
labels, axis ranges, sample size (n), error bars (indicating precision), and caption. Copy and paste your figure as part of your response to this question. Keep in
mind captions go below figures according to AJEV format.
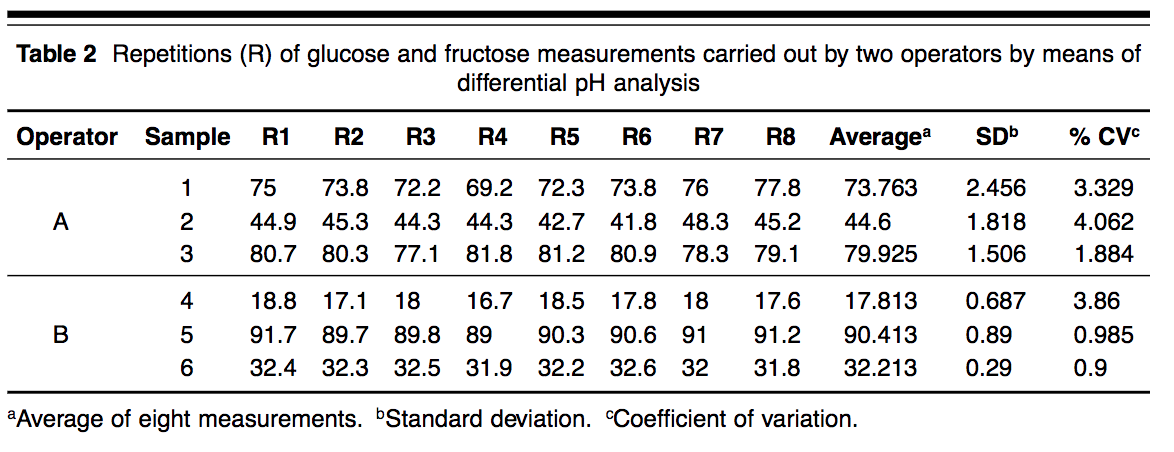
Table 2 Repetitions (R) of glucose and fructose measurements carried out by two operators by means of differential pH analysis Operator Sample R1 R2 R3 R4 R5 R6 R7 R8 Averagea SDb % CVC C N - 75 73.8 72.2 69.2 72.3 73.8 76 77.8 73.763 2.456 3.329 A 44.9 45.3 44.3 44.3 42.7 41.8 48.3 45.2 44.6 1.818 4.062 80.7 80.3 77.1 81.8 81.2 80.9 78.3 79.1 79.925 1.506 1.884 4 18.8 17.1 18 16.7 18.5 17.8 18 17.6 17.813 0.687 3.86 B 5 91.7 89.7 89.8 89 90.3 90.6 91 91.2 90.413 0.89 0.985 6 32.4 32.3 32.5 31.9 32.2 32.6 32 31.8 32.213 0.29 0.9 * Average of eight measurements. Standard deviation. Coefficient of variation
Step by Step Solution
There are 3 Steps involved in it

Get step-by-step solutions from verified subject matter experts