

Question: Using the data for Sample A and Sample B, create frequency distribution tables for each sample. Your tables must include frequency, frequency percentage, and
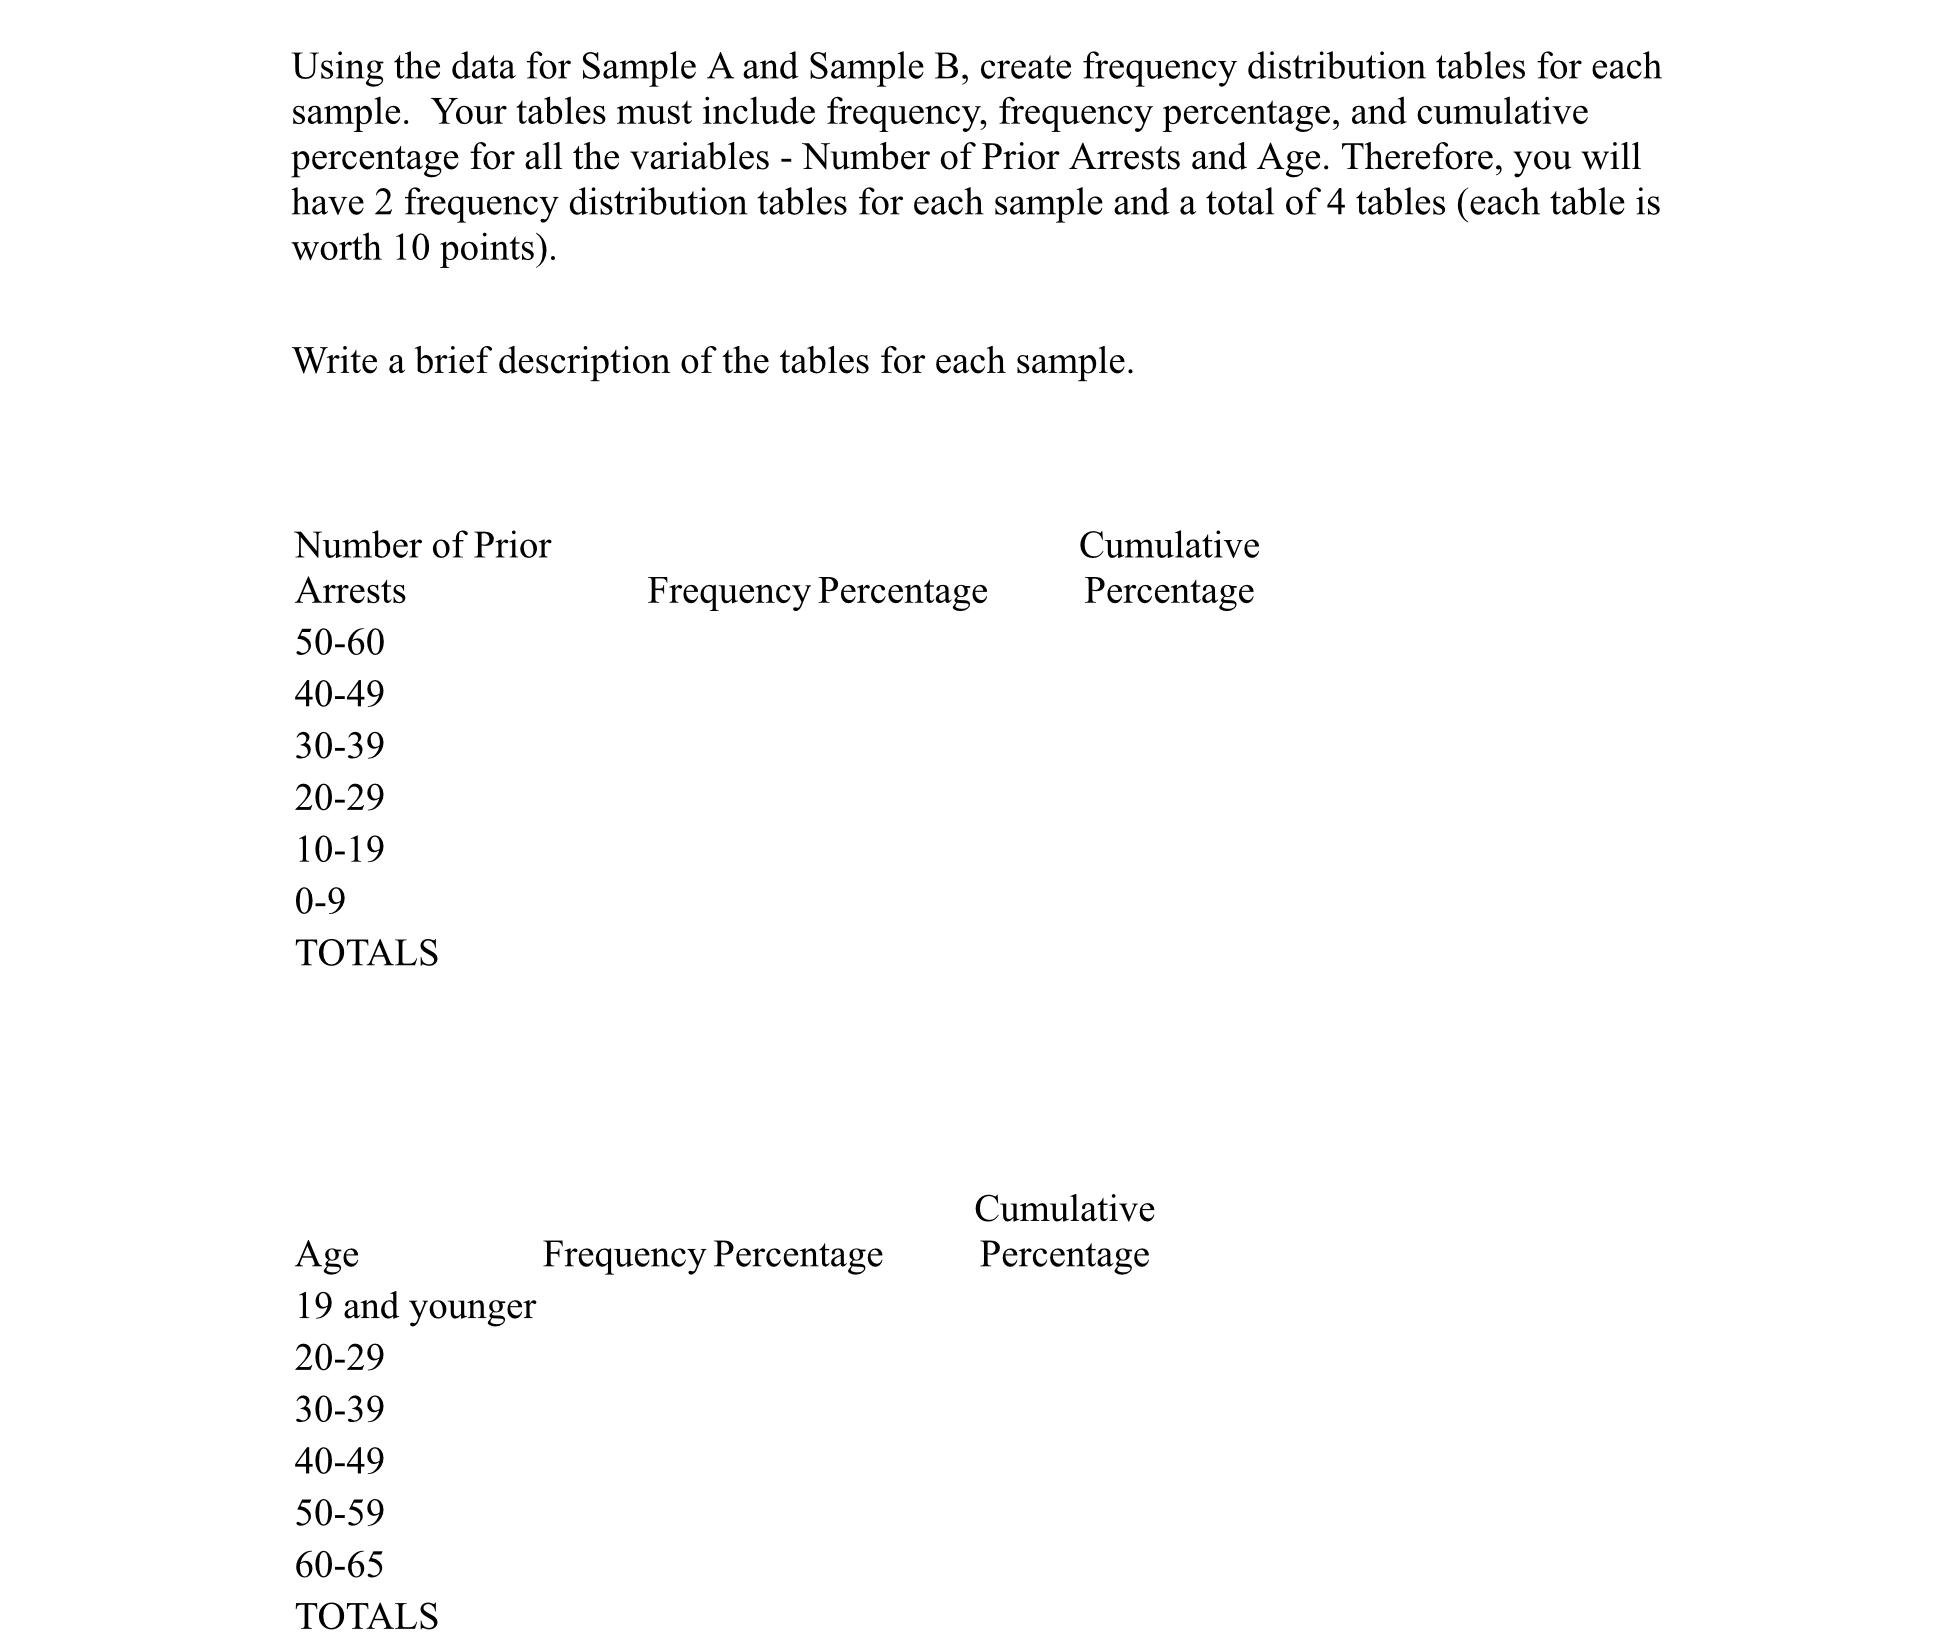

Using the data for Sample A and Sample B, create frequency distribution tables for each sample. Your tables must include frequency, frequency percentage, and cumulative percentage for all the variables - Number of Prior Arrests and Age. Therefore, you will have 2 frequency distribution tables for each sample and a total of 4 tables (each table is worth 10 points). Write a brief description of the tables for each sample. Number of Prior Arrests 50-60 40-49 30-39 20-29 10-19 0-9 TOTALS Age 19 and younger 20-29 30-39 40-49 50-59 60-65 TOTALS Frequency Percentage Frequency Percentage Cumulative Percentage Cumulative Percentage Sample A Priors 12 15 11 16 21 15 21 8 6 2 22 26 27 36 34 33 38 42 44 47 54 55 51 56 24 24 30 25 27 33 40 18 18 18 50 55 65 40 30 33 38 40 25 27 25 40 20 25 Age Sample B 53 57 49 45 45 47 43 31 12 14 15 16 22 29 29 54 56 57 59 54 56 43 44 41 Priors 40 50 45 40 42 40 40 18 30 40 45 40 27 25 25 45 55 60 47 48 50 25 23 21 Age
Step by Step Solution
There are 3 Steps involved in it
Sample A Number of Prior Arrests Frequency Distribution Table Number of Prior Arrests Frequency Freq... View full answer

Get step-by-step solutions from verified subject matter experts