

Question: Using the data from Table 12.3, what is the volatility of an equally weighted portfolio of McDonalds and Starbucksack? The volatility of the portfolio is
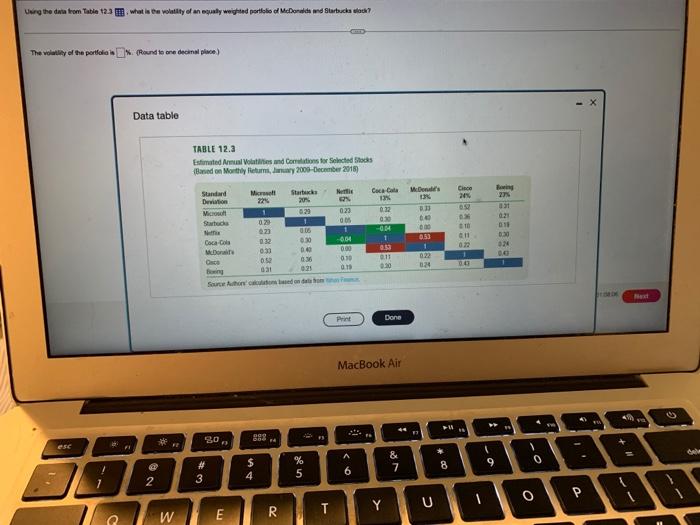
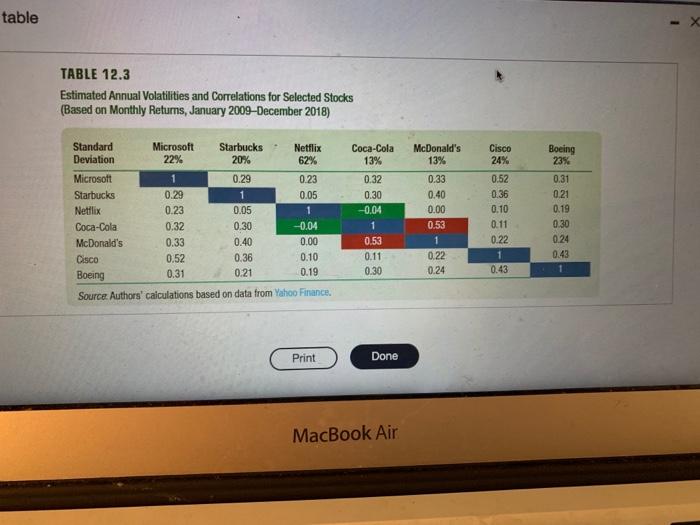
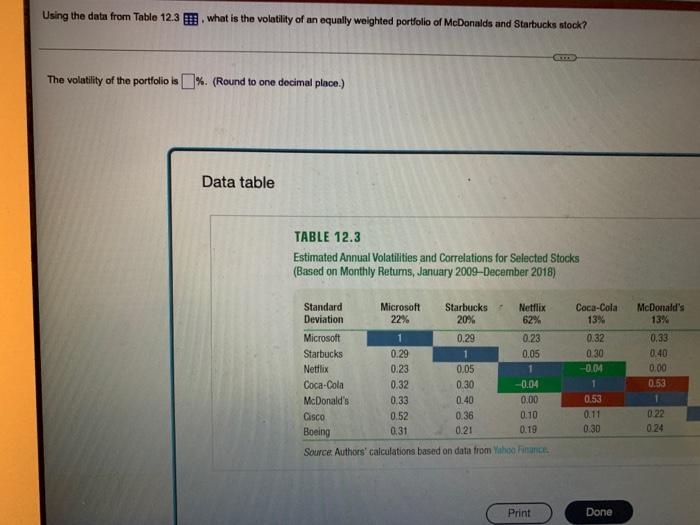
Using the data from Table 12.3, what is the volatility of an equally weighted portfolio of McDonalds and Starbucksack? The volatility of the portfolio is (Round to one decimal place) Data table TABLE 12.3 Estimated Annual Volatilities and Comalations for Selected Stocks (Based on Monthly Returns, January 2009 December 2018) Standard Deviation Microsoft Starbucks 22% Nettic 62% 20% Microsoft 1 0.29 0.23 0.29 005 1 Starbucks Neffix 22 0.06 1 Coca-Cola 0.32 0.30 -4.04 McDonat 0.33 0.40 0.00 0.52 0:36 0.30 Boxing 031 0.21 0.19 Source Author calculations based on data from t Print Done MacBook Air at 30, 892 in esc FI * @ 2 FE W #3 $ F4 4 E R % 5 un je T 6 Coca-Cola McDon's 13% 13% 0:32 8.33 0.30 0.40 0.04 0.00 1 0.53 0.53 1 0.11 0.22 0.30 024 Y & : 7 U P 8 Cisco 24% 0.52 1.36 610 4.11 0.22 1 0.43 1 1 9 27% 831 0.21 018 0:30 024 - X BORDE BAA 0 P O Next 80 CADA table TABLE 12.3 Estimated Annual Volatilities and Correlations for Selected Stocks (Based on Monthly Returns, January 2009-December 2018) Netflix Standard Deviation Microsoft Starbucks 22% 20% 62% Microsoft 1 0.29 0.23 Starbucks 0.29 1 0.05 Netflix 0.23 0.05 1 Coca-Cola 0.32 0.30 -0.04 McDonald's 0.33 0.40 0.00 Cisco 0.52 0.36 0.10 0.31 Boeing 0.19 0.21 Source Authors' calculations based on data from Yahoo Finance. Print Done MacBook Air Coca-Cola 13% 0.32 0.30 -0.04 1 0.53 0.11 0.30 McDonald's 13% 0.33 0.40 0.00 0.53 1 0.22 0.24 Cisco 24% 0.52 0.36 0.10 0.11 0.22 1 0.43 Boeing 23% 0.31 0.21 0.19 0.30 0.24 0.43 Using the data from Table 12.3. what is the volatility of an equally weighted portfolio of McDonalds and Starbucks stock? GTTS The volatility of the portfolio is%. (Round to one decimal place.) Data table TABLE 12.3 Estimated Annual Volatilities and Correlations for Selected Stocks (Based on Monthly Returns, January 2009 December 2018) Netflix Standard Deviation Microsoft Starbucks 22% 20% 62% Microsoft 1 0.29 0.23 Starbucks 0.29 1 0.05 Netflix 0.23 0.05 1 Coca-Cola 0.32 0.30 -0.04 McDonald's 0.33 0.40 0.00 Cisco 0,52 0.36 0.10 Boeing 0.31 0.21 0.19 Source Authors' calculations based on data from Yahoo Finance. Print Coca-Cola 13% 0.32 0.30 -0.04 1 0.53 0.11 0.30 Done McDonald's 13% 0.33 0.40 0.00 0.53 1 0.22 0.24
Step by Step Solution
There are 3 Steps involved in it

Get step-by-step solutions from verified subject matter experts