

Question: Using the data from the table shown below, what is the covariance between HP and Kellogg? using the data from the table shown below, what
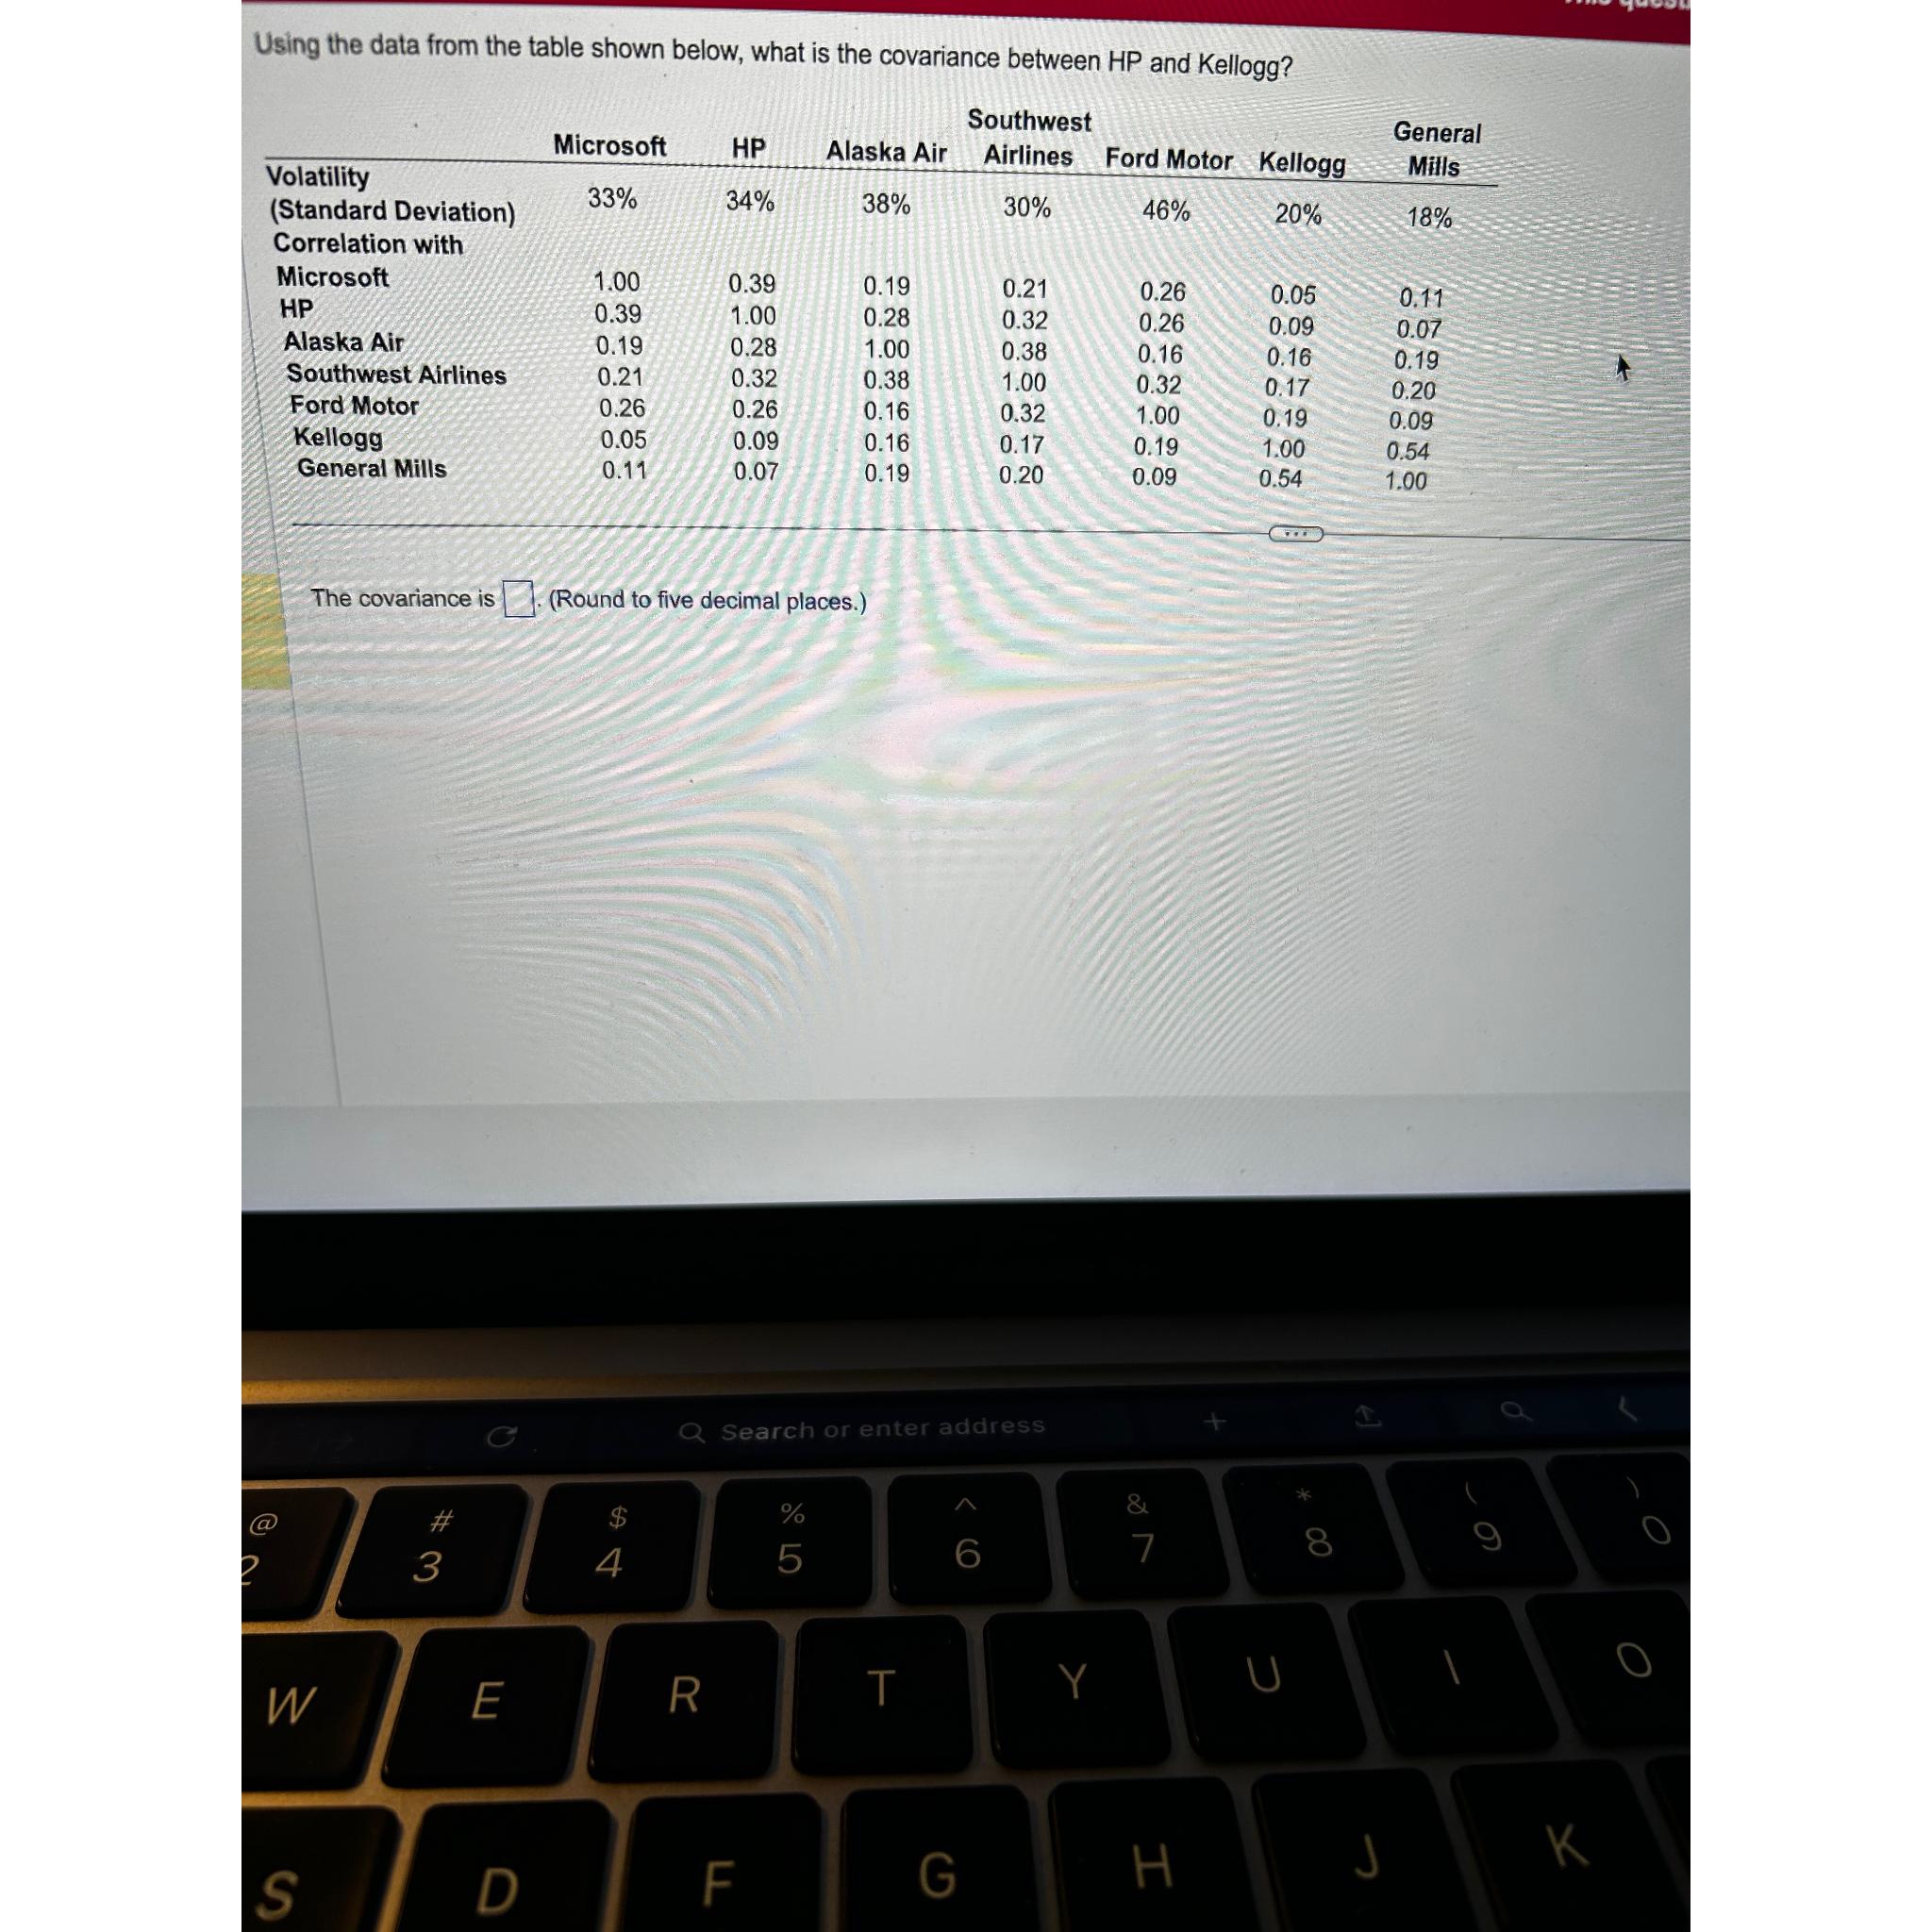
using the data from the table shown below, what is the covariance between HP and Kellogg? Volatility (Standard Deviation) Correlation with Microsoft Alaska Air Southwest Airlines Ford Motor Kellogg General Mills Microsoft 33% 1.00 0.39 0.19 0.21 0.26 0.05 0.11 HP 34% 0.39 1.00 0.28 0.32 0.26 0.09 0.07 Southwest Alaska Air Airlines Ford Motor Kellogg 38% 0.19 0.28 1.00 0.38 0.16 0.16 0.19 30% 0.21 0.32 0.38 1.00 0.32 0.17 0.20 460/0 0.26 0.26 0.16 0.32 1.00 0.19 0.09 20% 0.05 0.09 0.16 0.17 0.19 1.00 0.54 General Mills 18% 0.11 0.07 0.19 0.20 0.09 0.54 1.00 The Covariance is a. (Round to five decimal places.)
Step by Step Solution
There are 3 Steps involved in it

Get step-by-step solutions from verified subject matter experts