

Question: Using the data given in the table I am very perplexed in this question. 1. Calculate the following values for the variable fear: Mean =

Using the data given in the table I am very perplexed in this question.
1. Calculate the following values for the variable "fear":
Mean =
Mode =
Median =
2. Based on the values calculated above, what type of distribution is the variable "fear" most likely to have?
Group of answer choices
leptokurtic
platykurtic
positively skewed
negatively skewed
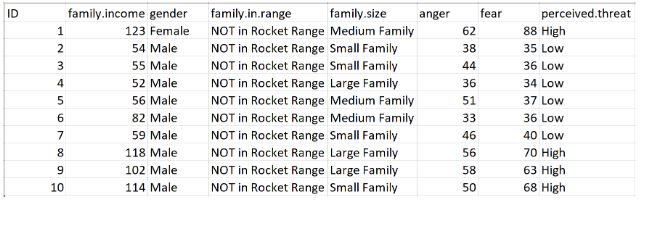
ID family.income gender family.in.range family.size anger fear perceived.threat 123 Female NOT in Rocket Range Medium Family 62 88 High 54 Male NOT in Rocket Range Small Family 38 35 Low 55 Male NOT in Rocket Range Small Family 44 36 Low 52 Male NOT in Rocket Range Large Family 36 34 Low 56 Male NOT in Rocket Range Medium Family 51 37 Low 82 Male NOT in Rocket Range Medium Family 33 36 Low 59 Male NOT in Rocket Range Small Family 46 40 Low 118 Male NOT in Rocket Range Large Family 56 70 High 102 Male NOT in Rocket Range Large Family 58 63 High 10 114 Male NOT in Rocket Range Small Family 50 68 High
Step by Step Solution
There are 3 Steps involved in it

Get step-by-step solutions from verified subject matter experts