Question: using the data given please answer question 1-4 in paragraph form Case 3.2 Hanover-Bates Chemical Corporation Student Version Case Case Summary James Sprague has been
using the data given please answer
question 1-4 in paragraph form
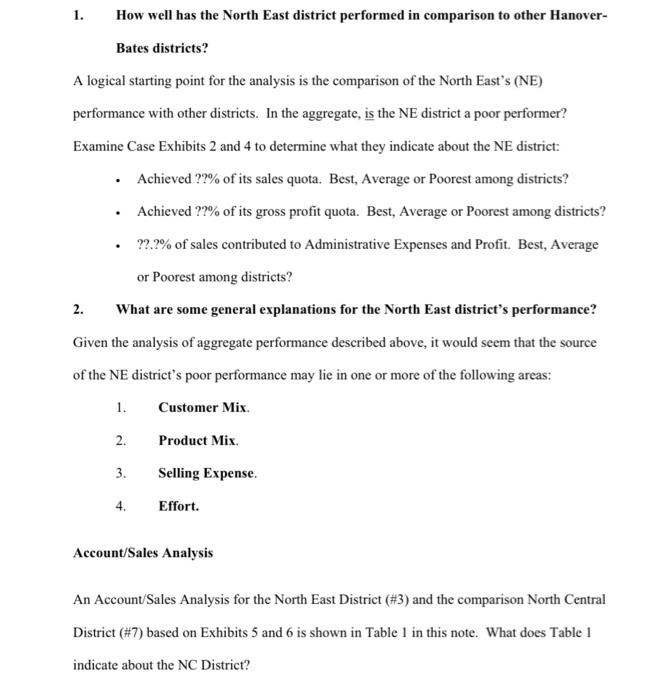
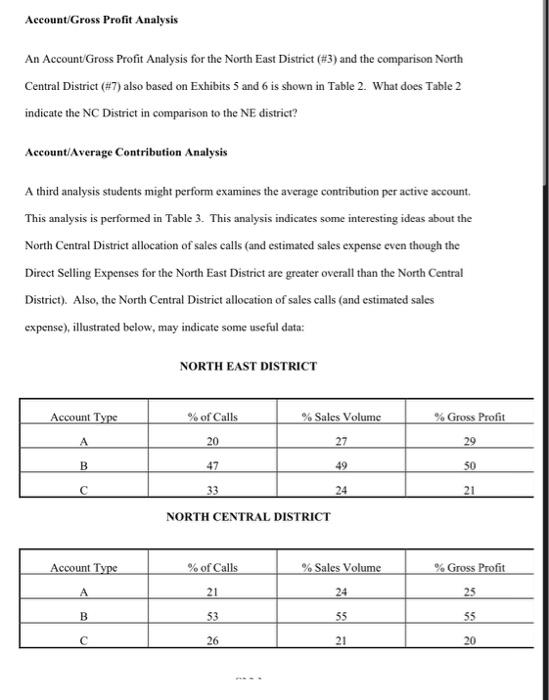
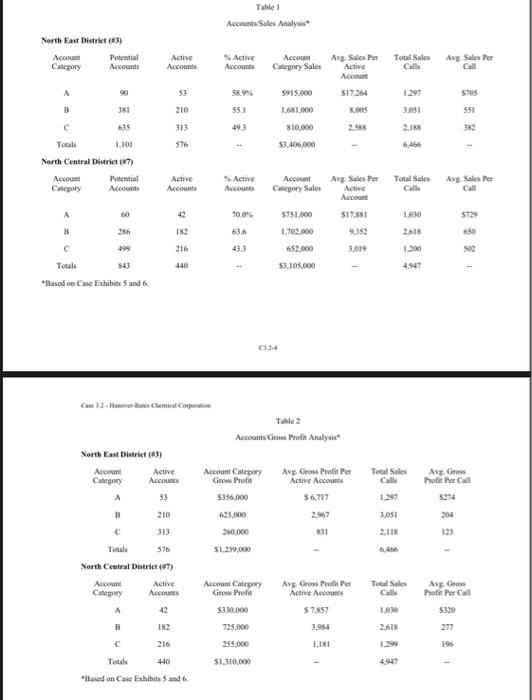
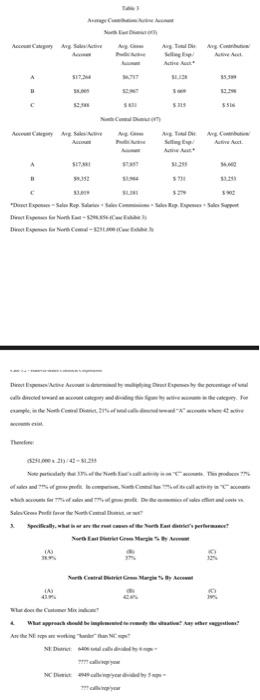
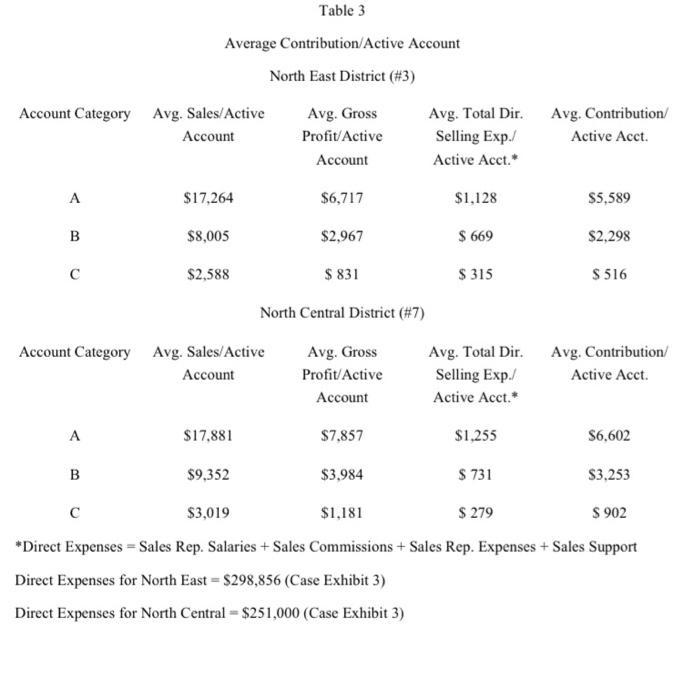
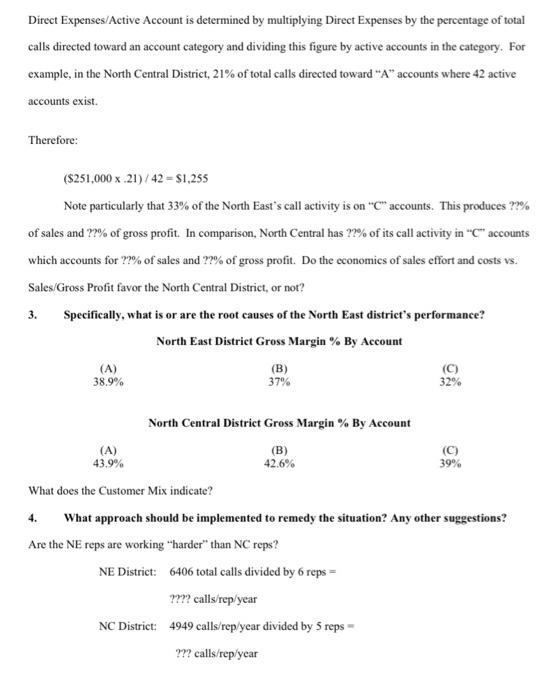
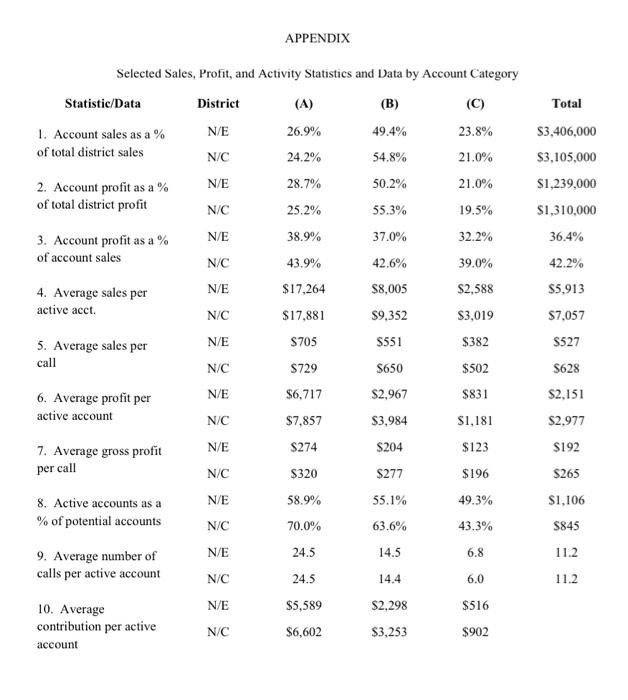
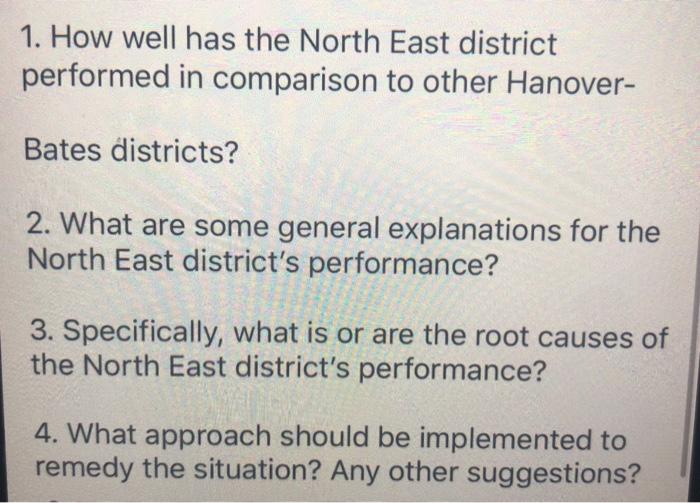
Case 3.2 Hanover-Bates Chemical Corporation Student Version Case Case Summary James Sprague has been recently appointed North East District Sales Manager for Hanover- Bates (H-B). It was his first managerial position. His assignment from the National Sales manager was to improve the district's profit performance. The case opens three days after his arrival in the district. After stating his intention to conduct a sales, profit, and activity analysis, the most experienced sales rep. threatens to quit. Despite this immediate personnel problem, the long run and more strategic consideration of customer and product mix sales and profitability in addition to sales effort allocation looms as the critical issue in the case. The student's task is one of sorting through a maze of sales, profit, and activity data to identify the source of the district's profit performance and recommend a course of action. 1. How well has the North East district performed in comparison to other Hanover- Bates districts? A logical starting point for the analysis is the comparison of the North East's (NE) performance with other districts. In the aggregate, is the NE district a poor performer? Examine Case Exhibits 2 and 4 to determine what they indicate about the NE district: Achieved ??% of its sales quota. Best, Average or Poorest among districts? Achieved ??% of its gross profit quota. Best, Average or Poorest among districts? ??.7% of sales contributed to Administrative Expenses and Profit. Best, Average or Poorest among districts? 2. What are some general explanations for the North East district's performance? Given the analysis of aggregate performance described above, it would seem that the source of the NE district's poor performance may lie in one or more of the following areas: 1. Customer Mix 2. Product Mix 3. Selling Expense. 4. Effort. Account/Sales Analysis An Account/Sales Analysis for the North East District (#3) and the comparison North Central District (#7) based on Exhibits 5 and 6 is shown in Table 1 in this note. What does Table 1 indicate about the NC District? Account/Gross Profit Analysis An Account Gross Profit Analysis for the North East District (#3) and the comparison North Central District (87) also based on Exhibits 5 and 6 is shown in Table 2. What does Table 2 indicate the NC District in comparison to the NE district? Account/Average Contribution Analysis A third analysis students might perform examines the average contribution per active account. This analysis is performed in Table 3. This analysis indicates some interesting ideas about the North Central District allocation of sales calls (and estimated sales expense even though the Direct Selling Expenses for the North East District are greater overall than the North Central District). Also, the North Central District allocation of sales calls (and estimated sales expense), illustrated below, may indicate some useful data: NORTH EAST DISTRICT Account Type % of Calls % Sales Volume % Gross Profit A 20 27 29 B 47 49 50 33 24 21 NORTH CENTRAL DISTRICT Account Type % of Calls % Sales Volume % Gross Profit A 21 24 25 B 53 55 35 26 21 20 Take 1 Account Sales Analysis North East District (3) Aco Potential Category Accounts Active Account * Active Accounts Act Category Sales Total Sales Calls Ang Sales Per Call Avg. Sales Per Active Acom $17.264 xos A 5915.000 Stos 53 210 B 381 55.1 1.297 3.051 2.15 551 C 635 1.681,000 810,000 53,406.000 493 Totals 1.101 North Central District (7) Account Potential Account Active Account Active Accounts Total Sales Avg Sales Per A 60 70.00 579 Account Aug. Sales Per Category Sales Active Accent 5751.000 $1781 .702,04 652.000 3.619 53.100.000 186 1.630 2,61 1.300 c 499 216 43,3 S2 440 4,947 Totals *Based on Che Exhibits 5 and 6 Tale 2 Accounts Grow Profit Analysis Account Catery Gross Profit 5356.000 Total Sales Calle Avg. Gross Profiter Active Accomm $6,717 2,967 Avg Gross Peter Call 5274 204 3.051 North East District (3) Account Active Category Accounts 53 B 210 C Toate 576 North Central Datret (7) Account Active Category Accounts A 260.000 S1,239,000 Account Category Grow Profit $330.000 Avg. Gross Pro Per Active Accounts $7.857 Total Sales Calls 1.030 Avg. Gross Prefi Per Call $320 B 725,000 277 C 216 255.000 196 SI 310,000 Totals 440 Based on Case Exhibits 5 and 6. Ang Ang Cart A 551 A 90 As the www ME Tamit as Table 3 Average Contribution/Active Account North East District (#3) Account Category Avg. Sales/Active Avg. Gross Avg. Total Dir. Avg. Contribution/ Account Profit/Active Selling Exp. Active Acct. Account Active Acct.* A $17,264 $6,717 $1,128 $5,589 B $8,005 $2,967 $ 669 $2,298 $2,588 $ 831 $ 315 $ 516 North Central District (#7) Account Category Avg. Sales/Active Avg. Gross Avg. Total Dir. Avg. Contribution/ Account Profit/Active Selling Exp. Active Acct. Account Active Acct.* A $17,881 $7.857 $1,255 $6,602 B $9,352 $3,984 $ 731 $3.253 $3,019 $1.181 $ 279 $ 902 *Direct Expenses = Sales Rep. Salaries + Sales Commissions + Sales Rep. Expenses + Sales Support Direct Expenses for North East = $298,856 (Case Exhibit 3) Direct Expenses for North Central $251,000 (Case Exhibit 3) Direct Expenses/Active Account is determined by multiplying Direct Expenses by the percentage of total calls directed toward an account category and dividing this figure by active accounts in the category. For example, in the North Central District, 21% of total calls directed toward "A" accounts where 42 active accounts exist. Therefore ($251.000 x 21)/42 = $1,255 Note particularly that 33% of the North East's call activity is on "C" accounts. This produces ??% of sales and 79% of gross profit. In comparison, North Central has ??% of its call activity in "C" accounts which accounts for ?7% of sales and 77% of gross profit. Do the economics of sales effort and costs vs. Sales/Gross Profit favor the North Central District, or not? Specifically, what is or are the root causes of the North East district's performance? North East District Gross Margin % By Account (A) (B) (C) 38.9% 32% 37% (C) North Central District Gross Margin%By Account (A) (B) 43.9% 42.6% 39% What does the Customer Mix indicate? 4. What approach should be implemented to remedy the situation? Any other suggestions? Are the NE reps are working harder than NC reps? NE District: 6406 total calls divided by 6 reps = ???? calls/rep/year NC District: 4949 calls/rep/year divided by 5 reps ??? calls/rep/year APPENDIX Total Selected Sales, Profit, and Activity Statistics and Data by Account Category Statistic/Data District 1. Account sales as a % N/E 26.9% 49.4% 23.8% of total district sales N/C 24.2% 54.8% 21.0% 2. Account profit as a % N/E 28.7% 50.2% 21.0% of total district profit N/C 25.2% 55.3% 19.5% $3,406,000 $3,105,000 $1,239,000 $1,310,000 NE 38.9% 37.0% 32.2% 36.4% 3. Account profit as a % of account sales N/C 42.6% 42.2% 43.9% $17,264 N/E $8,005 $5,913 4. Average sales per active acct. N/C $7,057 N/E 39.0% $2,588 $3,019 $382 $502 $831 5. Average sales per call $17,881 $705 $729 $6,717 $7,857 N/C $9,352 $551 S650 $2,967 $3,984 S527 3628 $2,151 N/E 6. Average profit per active account N/C $1,181 $2,977 NE $274 7. Average gross profit S204 $123 $192 per call N/C S320 $277 $196 S265 49.3% 8. Active accounts as a % of potential accounts NE N/C 55.1% 63.6% $1,106 5845 43.3% 58.9% 70.0% 24.5 24.5 NE 14.5 6.8 11.2 9. Average number of calls per active account N/C 14.4 6.0 11.2 N/E $5,589 $516 10. Average contribution per active $2,298 $3,253 N/C $6,602 $902 account 1. How well has the North East district performed in comparison to other Hanover- Bates districts? 2. What are some general explanations for the North East district's performance? 3. Specifically, what is or are the root causes of the North East district's performance? 4. What approach should be implemented to remedy the situation? Any other suggestions