

Question: Using the data I provided, calculate 60 months of returns for the SPDR S&P 500 Index ETF, Microsoft, Exxon, and the iShares 13 Year Treasury
Using the data I provided, calculate 60 months of returns for the SPDR S&P 500 Index ETF, Microsoft, Exxon, and the iShares 13 Year Treasury Bond ETF. (Please compute simple monthly returns not continuously compounded returns.) Compute the average monthly returns for the SPDR S&P 500 Index ETF, Microsoft, Exxon, and the iShares 13 Year Treasury Bond ETF. If you form an equally weighted portfolio with these three equities and one bond, what is your portfolios average monthly return? Enter your answer rounded to two decimal places. Do not enter % in the answer box. For example, if your answer is 0.12345 or 12.345% then enter as 12.35 in the answer box.
Data is posted below:
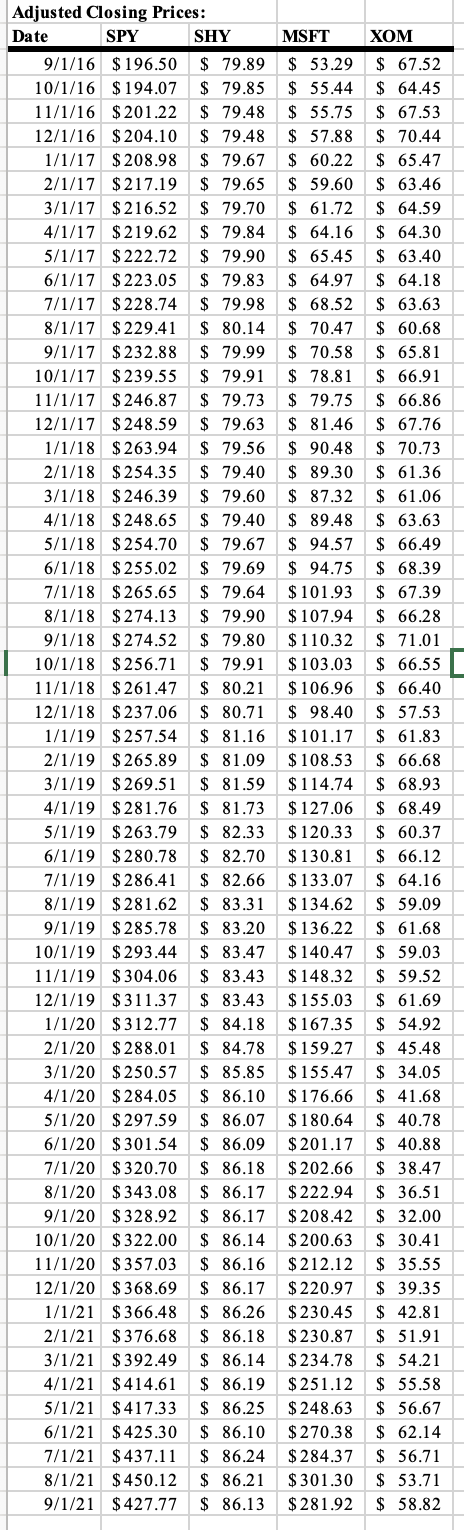
MSFT XOM Adjusted Closing Prices: Date SPY SHY 9/1/16 $196.50 $ 79.89 10/1/16 $194.07 $ 79.85 11/1/16 $201.22 $ 79.48 12/1/16 $204.10 $ 79.48 1/1/17 $ 208.98 $ 79.67 2/1/17 $ 217.19 $ 79.65 3/1/17 $216.52 $ 79.70 4/1/17 $219.62 $ 79.84 5/1/17 $ 222.72 $ 79.90 6/1/17 $223.05 $ 79.83 7/1/17 $228.74 $ 79.98 8/1/17 $ 229.41 $ 80.14 9/1/17 $232.88 $ 79.99 10/1/17 $ 239.55 $ 79.91 11/1/17 $ 246.87 $ 79.73 12/1/17 $ 248.59 $ 79.63 1/1/18 $263.94 $ 79.56 2/1/18 $254.35 $ 79.40 3/1/18 $ 246.39 $ 79.60 4/1/18 $ 248.65 $ 79.40 5/1/18 $254.70 $ 79.67 6/1/18 $255.02 $ 79.69 7/1/18 $265.65 $ 79.64 8/1/18 $274.13 $ 79.90 9/1/18 $ 274.52 $ 79.80 10/1/18 $256.71 $ 79.91 11/1/18 $261.47 $ 80.21 12/1/18 $ 237.06 $ 80.71 1/1/19 $257.54 $ 81.16 2/1/19 $265.89 $ 81.09 3/1/19 $ 269.51 $ 81.59 4/1/19 $281.76 $ 81.73 5/1/19 $ 263.79 $ 82.33 6/1/19 $280.78 $ 82.70 7/1/19 $286.41 $ 82.66 8/1/19 $281.62 $ 83.31 9/1/19 $285.78 $ 83.20 10/1/19 $293.44 $ 83.47 11/1/19 $ 304.06 $ 83.43 12/1/19 $311.37 $ 83.43 1/1/20 $312.77 $ 84.18 2/1/20 $288.01 $ 84.78 3/1/20 $250.57 $ 85.85 4/1/20 $284.05 $ 86.10 5/1/20 $ 297.59 $ 86.07 6/1/20 $ 301.54 $ 86.09 7/1/20 $320.70 $ 86.18 8/1/20 $343.08 $ 86.17 9/1/20 $328.92 $ 86.17 10/1/20 $322.00 $ 86.14 11/1/20 $ 357.03 $ 86.16 12/1/20 $368.69 $ 86.17 1/1/21 $ 366.48 $ 86.26 2/1/21 $376.68 $ 86.18 3/1/21 $392.49 $ 86.14 4/1/21 $ 414.61 $ 86.19 5/1/21 $ 417.33 $ 86.25 6/1/21 $425.30 $ 86.10 7/1/21 $ 437.11 $ 86.24 8/1/21 $ 450.12 $ 86.21 9/1/21 $427.77 $ 86.13 $ 53.29 $ 55.44 $ 55.75 $ 57.88 $ 60.22 $ 59.60 $ 61.72 $ 64.16 $ 65.45 $ 64.97 $ 68.52 $ 70.47 $ 70.58 $ 78.81 $ 79.75 $ 81.46 $ 90.48 $ 89.30 $ 87.32 $ 89.48 $ 94.57 $ 94.75 $ 101.93 $107.94 $110.32 $ 103.03 $ 106.96 $ 98.40 $ 101.17 $ 108.53 $ 114.74 $ 127.06 $ 120.33 $ 130.81 $133.07 $ 134.62 $136.22 $140.47 $ 148.32 $155.03 $167.35 $159.27 $155.47 $ 176.66 $ 180.64 $201.17 $ 202.66 $ 222.94 $ 208.42 $200.63 $212.12 $ 220.97 $ 230.45 $ 230.87 $ 234.78 $ 251.12 $ 248.63 $ 270.38 $ 284.37 $ 301.30 $281.92 $ 67.52 $ 64.45 $ 67.53 $ 70.44 $ 65.47 $ 63.46 $ 64.59 $ 64.30 $ 63.40 $ 64.18 $ 63.63 $ 60.68 $ 65.81 $ 66.91 $ 66.86 $ 67.76 $ 70.73 $ 61.36 $ 61.06 $ 63.63 $ 66.49 $ 68.39 $ 67.39 $ 66.28 $ 71.01 $ 66.55 $ 66.40 $ 57.53 $ 61.83 $ 66.68 $ 68.93 $ 68.49 $ 60.37 $ 66.12 $ 64.16 $ 59.09 $ 61.68 $ 59.03 $ 59.52 $ 61.69 $ 54.92 $ 45.48 $ 34.05 $ 41.68 $ 40.78 $ 40.88 $ 38.47 $ 36.51 $ 32.00 $ 30.41 $ 35.55 $ 39.35 $ 42.81 $ 51.91 $ 54.21 $ 55.58 $ 56.67 $ 62.14 $ 56.71 $ 53.71 $ 58.82 MSFT XOM Adjusted Closing Prices: Date SPY SHY 9/1/16 $196.50 $ 79.89 10/1/16 $194.07 $ 79.85 11/1/16 $201.22 $ 79.48 12/1/16 $204.10 $ 79.48 1/1/17 $ 208.98 $ 79.67 2/1/17 $ 217.19 $ 79.65 3/1/17 $216.52 $ 79.70 4/1/17 $219.62 $ 79.84 5/1/17 $ 222.72 $ 79.90 6/1/17 $223.05 $ 79.83 7/1/17 $228.74 $ 79.98 8/1/17 $ 229.41 $ 80.14 9/1/17 $232.88 $ 79.99 10/1/17 $ 239.55 $ 79.91 11/1/17 $ 246.87 $ 79.73 12/1/17 $ 248.59 $ 79.63 1/1/18 $263.94 $ 79.56 2/1/18 $254.35 $ 79.40 3/1/18 $ 246.39 $ 79.60 4/1/18 $ 248.65 $ 79.40 5/1/18 $254.70 $ 79.67 6/1/18 $255.02 $ 79.69 7/1/18 $265.65 $ 79.64 8/1/18 $274.13 $ 79.90 9/1/18 $ 274.52 $ 79.80 10/1/18 $256.71 $ 79.91 11/1/18 $261.47 $ 80.21 12/1/18 $ 237.06 $ 80.71 1/1/19 $257.54 $ 81.16 2/1/19 $265.89 $ 81.09 3/1/19 $ 269.51 $ 81.59 4/1/19 $281.76 $ 81.73 5/1/19 $ 263.79 $ 82.33 6/1/19 $280.78 $ 82.70 7/1/19 $286.41 $ 82.66 8/1/19 $281.62 $ 83.31 9/1/19 $285.78 $ 83.20 10/1/19 $293.44 $ 83.47 11/1/19 $ 304.06 $ 83.43 12/1/19 $311.37 $ 83.43 1/1/20 $312.77 $ 84.18 2/1/20 $288.01 $ 84.78 3/1/20 $250.57 $ 85.85 4/1/20 $284.05 $ 86.10 5/1/20 $ 297.59 $ 86.07 6/1/20 $ 301.54 $ 86.09 7/1/20 $320.70 $ 86.18 8/1/20 $343.08 $ 86.17 9/1/20 $328.92 $ 86.17 10/1/20 $322.00 $ 86.14 11/1/20 $ 357.03 $ 86.16 12/1/20 $368.69 $ 86.17 1/1/21 $ 366.48 $ 86.26 2/1/21 $376.68 $ 86.18 3/1/21 $392.49 $ 86.14 4/1/21 $ 414.61 $ 86.19 5/1/21 $ 417.33 $ 86.25 6/1/21 $425.30 $ 86.10 7/1/21 $ 437.11 $ 86.24 8/1/21 $ 450.12 $ 86.21 9/1/21 $427.77 $ 86.13 $ 53.29 $ 55.44 $ 55.75 $ 57.88 $ 60.22 $ 59.60 $ 61.72 $ 64.16 $ 65.45 $ 64.97 $ 68.52 $ 70.47 $ 70.58 $ 78.81 $ 79.75 $ 81.46 $ 90.48 $ 89.30 $ 87.32 $ 89.48 $ 94.57 $ 94.75 $ 101.93 $107.94 $110.32 $ 103.03 $ 106.96 $ 98.40 $ 101.17 $ 108.53 $ 114.74 $ 127.06 $ 120.33 $ 130.81 $133.07 $ 134.62 $136.22 $140.47 $ 148.32 $155.03 $167.35 $159.27 $155.47 $ 176.66 $ 180.64 $201.17 $ 202.66 $ 222.94 $ 208.42 $200.63 $212.12 $ 220.97 $ 230.45 $ 230.87 $ 234.78 $ 251.12 $ 248.63 $ 270.38 $ 284.37 $ 301.30 $281.92 $ 67.52 $ 64.45 $ 67.53 $ 70.44 $ 65.47 $ 63.46 $ 64.59 $ 64.30 $ 63.40 $ 64.18 $ 63.63 $ 60.68 $ 65.81 $ 66.91 $ 66.86 $ 67.76 $ 70.73 $ 61.36 $ 61.06 $ 63.63 $ 66.49 $ 68.39 $ 67.39 $ 66.28 $ 71.01 $ 66.55 $ 66.40 $ 57.53 $ 61.83 $ 66.68 $ 68.93 $ 68.49 $ 60.37 $ 66.12 $ 64.16 $ 59.09 $ 61.68 $ 59.03 $ 59.52 $ 61.69 $ 54.92 $ 45.48 $ 34.05 $ 41.68 $ 40.78 $ 40.88 $ 38.47 $ 36.51 $ 32.00 $ 30.41 $ 35.55 $ 39.35 $ 42.81 $ 51.91 $ 54.21 $ 55.58 $ 56.67 $ 62.14 $ 56.71 $ 53.71 $ 58.82
Step by Step Solution
There are 3 Steps involved in it

Get step-by-step solutions from verified subject matter experts