

Question: Using the data in Ch. 13 Data Set 2 and Excel, compute the F ratio for a comparison among the three levels representing the average
Using the data in Ch. 13 Data Set 2 and Excel, compute the F ratio for a comparison among the three levels representing the average amount of time that swimmers practice weekly (25), with the outcome variable being their time for the 100-yard freestyle. Answer the question of whether practice time makes a difference. Don't forget to use the options feature to get the means for the groups.
(You will be using a One-Way ANOVA to determine if there is a statistically significant difference between the 3 groups of practice times)
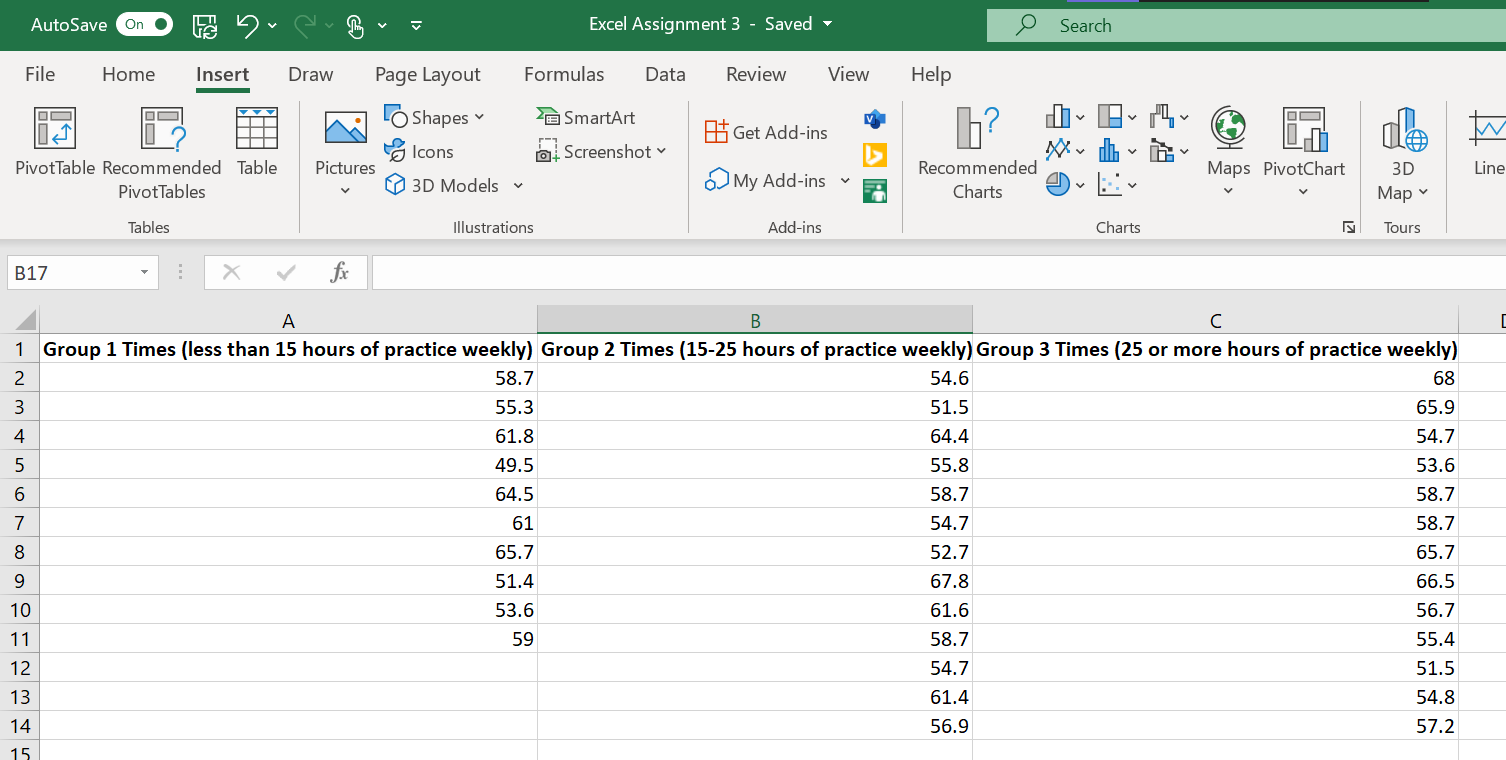
AutoSave On Excel Assignment 3 - Saved 9 Search File Home Insert Draw Page Layout Formulas Data Review View Help i LO Shapes SmartArt Icons Get Add-ins PivotTable Recommended Table Pictures al Screenshot Recommended Maps PivotChart Line PivotTables 3D Models v My Add-ins 3D Charts Map v Tables Illustrations Add-ins Charts Tours B17 X A B C 1 Group 1 Times (less than 15 hours of practice weekly) Group 2 Times (15-25 hours of practice weekly) Group 3 Times (25 or more hours of practice weekly) IN 58.7 54.6 68 W 55.3 51.5 65.9 UI A 61.8 64.4 54.7 49.5 55.8 53.6 64.5 58.7 58.7 00 - 61 54.7 58.7 65.7 52.7 65.7 51.4 67.8 66.5 10 53.6 61.6 56.7 11 59 58.7 55.4 12 54.7 51.5 13 61.4 54.8 14 56.9 57.2 15
Step by Step Solution
There are 3 Steps involved in it

Get step-by-step solutions from verified subject matter experts