

Question: Using the data in E4-2 and spreadsheet software, determine: 1. The variable cost per unit, the total fixed cost, and R2. 2. The plotted data
Using the data in E4-2 and spreadsheet software, determine:
1. The variable cost per unit, the total fixed cost, and R2.
2. The plotted data points using the graphing function.
3. Compare the results to your solutions in E4-2 and E4-3.
Reference: E4-3
Scattergraph method
Using the data in E4-2 and a piece of graph paper:
1. Plot the data points on the graph and draw a line by visual inspection, indicating the trend shown by the data points.
2. Determine the variable cost per unit and the total fixed cost from the information on the graph.
Reference: E4-2
High-low method
Tucson Tractor Inc. has accumulated the following data over a six-month period:
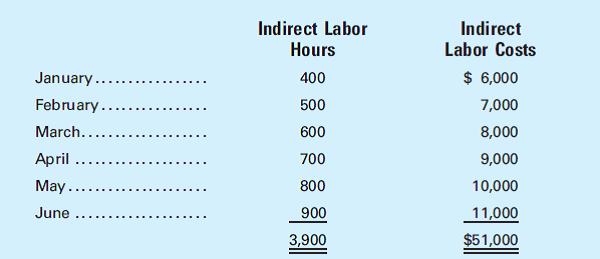
Separate the indirect labor into its fixed and variable components, using the high-low method.
Indirect Labor Hours Indirect Labor Costs January... 400 $ 6,000 February.. 500 7,000 March... 600 8,000 April .... 700 9,000 May... 800 10,000 June 900 11,000 3,900 $51,000
Step by Step Solution
There are 3 Steps involved in it
4E Following information is given in the ... View full answer

Get step-by-step solutions from verified subject matter experts