

Question: Using the data in Table 1, answer the following questions: a.Calculate the absolute change in government expenditure on education (as % of GDP) between 2005
Using the data in Table 1, answer the following questions:
- a.Calculate the absolute change in government expenditure on education (as % of GDP) between 2005 and 2020 in Botswana, and also in Sweden and Hong Kong (in percentage points). How do the three countries compare? Include your workings and report your answers to one decimal place.
- b.Calculate the percentage change in (i) government expenditure on education (% of GDP) as well as (ii) government final consumption expenditure (% of GDP) between 1990-2020 in Hong Kong. Include your workings and report your answers to one decimal place.
- c.Use Excel to calculate the average for all three countries in 2020 for both indicators: government expenditure on education (% of GDP) and government final consumption expenditure (% of GDP). Briefly compare each country against the average. Include your workings and report your answers to one decimal place.
- d.Use Excel to create a 'Combo' chart ('Clustered column - Scatter on Secondary Axis' chart type), which displays government expenditure on education (% of GDP) in Botswana, Sweden and Hong Kong in 2020 as clustered columns, while displaying government final consumption expenditure (% of GDP) in Botswana, Sweden and Hong Kong in 2020 as scatter points on a secondary axis.
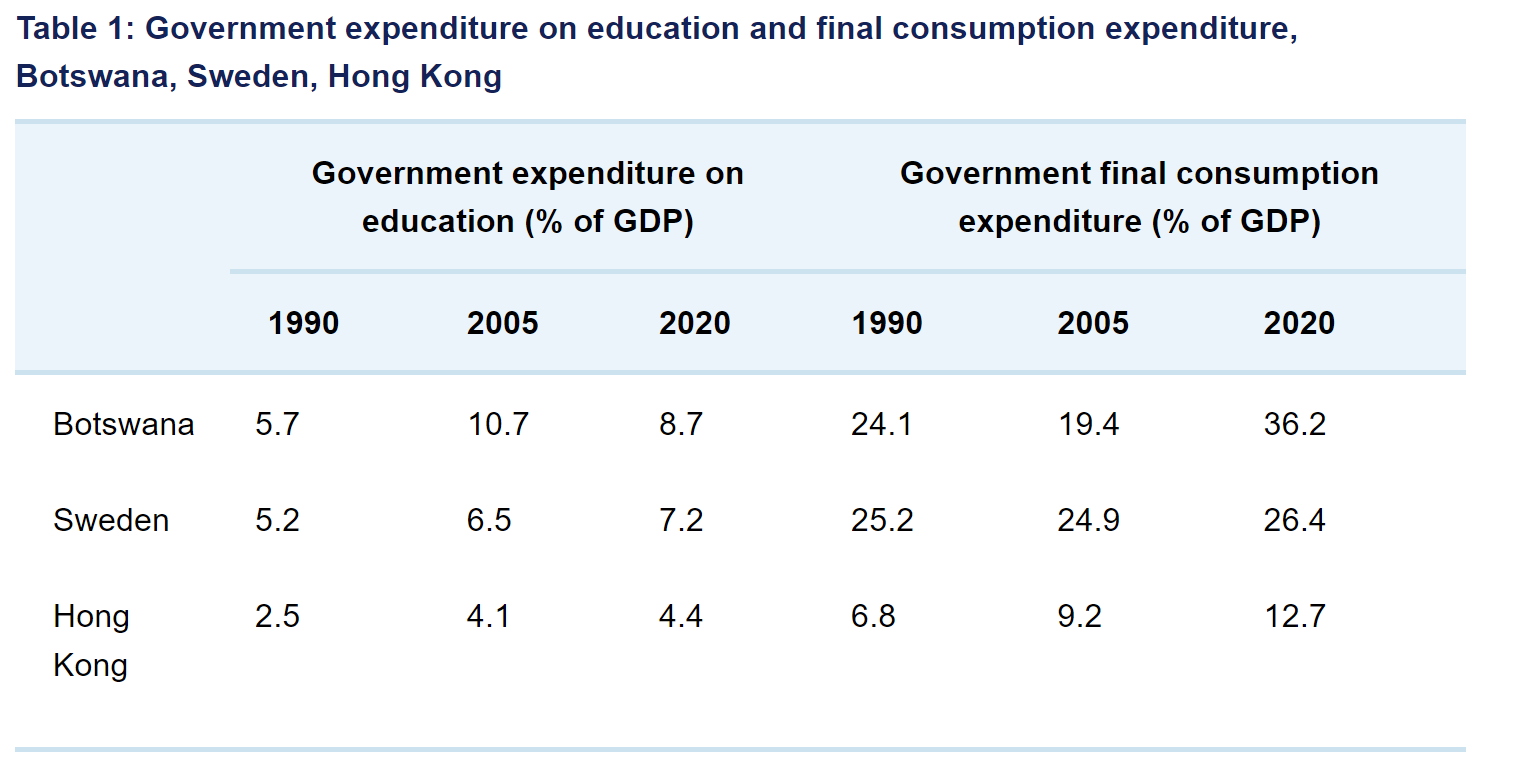
Table 1: Government expenditure on education and final consumption expenditure, Botswana, Sweden, Hong Kong Government expenditure on Government final consumption education (% of GDP) expenditure (% of GDP) 1990 2005 2020 1990 2005 2020 Botswana 5.7 10.7 8.7 24.1 19.4 36.2 Sweden 5.2 6.5 7.2 25.2 24.9 26.4 Hong 2.5 4.1 4.4 6.8 9.2 12.7 Kong
Step by Step Solution
There are 3 Steps involved in it
1 Expert Approved Answer
Step: 1 Unlock

Question Has Been Solved by an Expert!
Get step-by-step solutions from verified subject matter experts
Step: 2 Unlock
Step: 3 Unlock