

Question: Using the data in Table 1, explain how you would use appropriate methods of analysis such as regression analysis or correlation analysis to analyze the
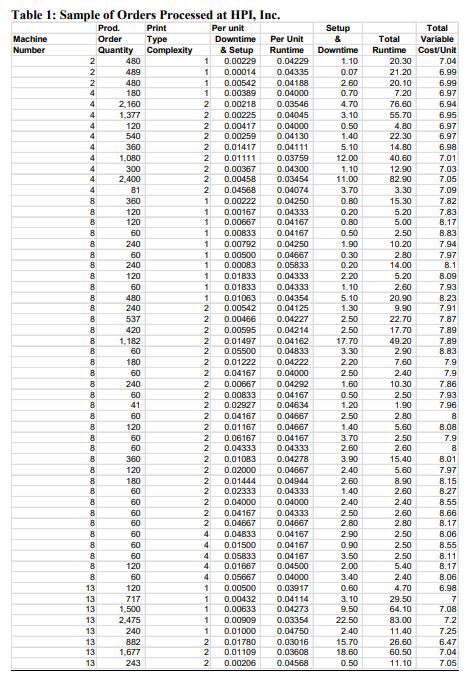
Using the data in Table 1, explain how you would use appropriate methods of analysis such as regression analysis or correlation analysis to analyze the effect of order size and product variety on the productivity and cost structure of the Lexington plant.
Table 1: Sample of Orders Processed at HPI, Inc. Per unit Prod. Order Quantity Downtime Machine Number 2 2 2 4 4 4 4 4 4 4 4 4 4 8 8 8 8 8 8 8 8 8 8 8 8 8 8 8 8 8 8 8 8 8 8 8 8 8 8 8 8 8 8 8 8 8 8 8 8 wwwwwwwww 13 13 13 13 13 13 13 13 480 489 480 180 2,160 1,377 120 540 360 1,080 300 2,400 81 360 120 120 60 240 60 240 120 60 480 240 537 420 1,182 60 180 60 240 60 41 60 120 60 60 360 120 180 60 60 888 60 60 60 60 60 120 60 120 717 1,500 2,475 240 882 1,677 243 Print Type Complexity 1 1 1 1 & Setup 0.00229 0.04229 0.00014 0.04335 0.00542 0.04188 0.00389 0.04000 2 0.00218 0.03546 0.00225 0.04045 2 2 0.00417 0.04000 2 0.00259 0.04130 0.04111 2 0.01417 2 0.01111 0.03759 2 0.00367 0.00458 0.04300 0.03454 0.04568 0.04074 1 0.00222 1 0.00167 2 2 1 0.00667 1 0.00833 1 0.00792 1 0.00500 1 0.00083 1 0.01833 0.01833 1 1 0.01063 2 0.00542 2 0.00466 0.00595 2 2 2 0.04214 0.04162 0.04833 2 0.01222 0.04222 2 0.04167 0.04000 0.04292 0.04167 0.04634 Per Unit Runtime 0.01497 0.05500 2 0.02000 2 0.01444 2 0.02333 2 0.04000 2 0.04167 2 0.04667 4 0.04833 4 0.01500 4 0.05833 4 0.01667 0.05667 0.00500 4 2 0.00667 2 0.00833 2 0.02927 2 0.04167 0.04667 0.01167 0.04667 2 2 0.06167 0.04167 2 0.04333 0.04333 2 0.01083 0.04278 0.04667 0.04944 0.04333 0.04000 0.04333 0.04667 0.04167 0.04167 0.04167 0.04500 1 0.04250 0.04333 0.04167 0.04167 0.04250 0.04667 0.05833 0.04333 0.04333 0.04354 0.04125 0.04227 0.04000 0.03917 0.04114 0.04273 0.03354 0.04750 2 0.01780 0.03016 2 0.01109 0.03608 2 0.00206 0.04568 1 0.00432 1 1 0.00909 0.00633 1 0.01000 Setup & Downtime 1.10 0.07 2.60 0.70 4.70 3.10 0.50 1.40 5.10 12.00 1.10 11.00 3.70 0.80 0.20 0.80 0.50 1.90 0.30 0.20 2.20 1.10 5.10 1.30 2.50 2.50 17.70 3.30 2.20 2.50 1.60 0.50 1.20 2.50 1.40 3.70 2.60 3.90 2.40 2.60 1.40 2.40 2.50 2.80 2.90 0.90 3.50 2.00 3.40 0.60 3.10 9.50 22.50 2.40 15.70 18.60 0.50 Total Runtime 20.30 21.20 20.10 7.20 76.60 55.70 4.80 22.30 14.80 40.60 12.90 82.90 3.30 15.30 5.20 5.00 2.50 10.20 2.80 14.00 5.20 2.60 20.90 9.90 22.70 17.70 49.20 2.90 7.60 2.40 10.30 2.50 1.90 2.80 5.60 2.50 2.60 15.40 5.60 8.90 2.60 2.40 2.60 2.80 2.50 2.50 2.50 5.40 2.40 4.70 29.50 64.10 83.00 11.40 26.60 60.50 11.10 Total Variable Cost/Unit 7.04 6.99 6.99 6.97 6.94 6.95 6.97 6.97 6.98 7.01 7.03 7.05 7.09 7.82 7.83 8.17 8.83 7.94 7.97 8.1 8.09 7.93 8.23 7.91 7.87 7.89 7.89 8.83 7.9 7.9 7.86 7.93 7.96 8 m 8.08 7.9 8 8.01 7.97 8.15 8.27 8.55 8.66 8.17 8.06 8.55 8.11 8.17 8.06 6.98 7 7.08 7.2 7.25 6.47 7.04 7.05
Step by Step Solution
3.52 Rating (165 Votes )
There are 3 Steps involved in it
Whenever using regression analysis the pvalue will determine the significance Whenever the p value is less than 005 we can say that the relationship i... View full answer

Get step-by-step solutions from verified subject matter experts