

Question: Using the data in Table A: 1. [1] (a) Calculate the total size of the population of Japan on 30/6/2020. 2. [2] (b) Calculate the
Using the data in Table A:
1. [1] (a) Calculate the total size of the population of Japan on 30/6/2020.
2. [2] (b) Calculate the overall sex ratio of population of Japan on 30/6/2020, expressing your answer in terms of males per 100 females and to 1 decimal place.
4. [4] (c) Calculate the median age for the male population of Japan on 30/6/2020 and the median age for the female population of Japan on 30/6/2020, giving your answers to 1 decimal place.
5. [5] (d) Calculate the total percentage distribution of the population of Japan on 30/6/2020 by age and sex, expressing each percentage to 1 decimal place.
[2] (e) Plot a population pyramid showing the percentage distribution of the population of Japan by age and sex on 30/6/2020.
[20] (f) Describe and suggest explanations for the features of the age-sex distribution of the population of Japan on 30/6/2020. (500 w0rds)
[20] (g) Project the numbers of males by age and the numbers of females by age for Japan on 30/6/2025 assuming the following:
(i) the survivorship ratios (proportions surviving) between 30/6/2020 and 30/6/2025 by age on 30/6/2020 are as given in Table B (see following page);
(ii), annual net migration by age (at migration) for males and females is constant at the levels in Table B;
(iii) age-specific fertility rates for females are constant at the levels in Table B;
(iv) the sex ratio at birth is constant at 107 males per 100 females;
(v) the population on 30/6/2020 is as in Table A.
Each projected number should be given to the nearest whole number.
Table B -(h) Describe and account for the differences between the total population size and its distribution by age and sex between your projected population for Japan on 30/6/2025 (i.e. differences between your answers to part g) and the population of Japan on 30/6/2020, given in Table A).
(5oo w0rds).
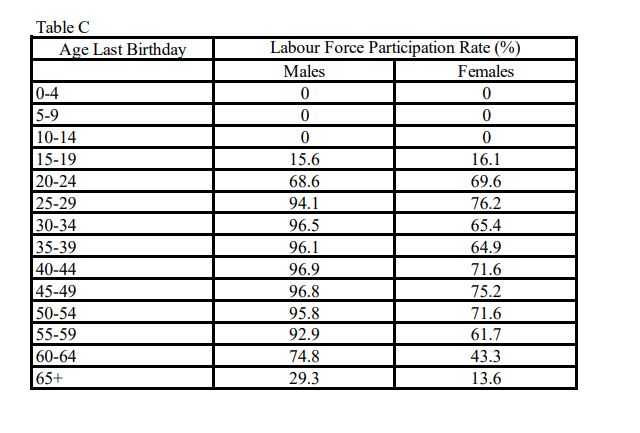
TABLE C
(i) Describe and suggest explanations for the variation in labour force participation rates by age and sex for Japan on 30/6/2019.
(5oo w0rds).
(j) Assuming all age-specific labour force participation rates for males and females on 30/6/2025 are the same as those given in Table C and the projected population on 30/6/2025 by age and sex is as per your answer to part g), project the numbers of males and females in the labour force for Japan on 30/6/2025 for each of the age groups tabulated in Table C, giving each answer to the nearest whole number.
![Using the data in Table A:1. [1] (a) Calculate the total size](https://dsd5zvtm8ll6.cloudfront.net/si.experts.images/questions/2024/10/6715c465802ba_7816715c4656554f.jpg)
![of the population of Japan on 30/6/2020.2. [2] (b) Calculate the overall](https://dsd5zvtm8ll6.cloudfront.net/si.experts.images/questions/2024/10/6715c465f307e_7816715c465d043a.jpg)
\f\f\f
Step by Step Solution
There are 3 Steps involved in it

Get step-by-step solutions from verified subject matter experts