

Question: Using the data in Table , plot a graph with Do as abscissa and Di as ordinate . use equal scales on both axes starting
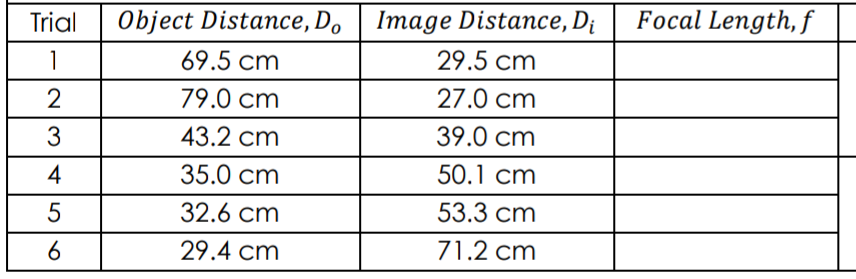
Using the data in Table , plot a graph with Do as abscissa and Di as ordinate . use equal scales on both axes starting from zero. Draw a smooth rectangular parabola through the mean of the points plotted . Then draw a 45 line coming from the origin ( bisecting the axes) and extend until it intersects the hyperbola. Determine the coordinates of the intersection\f
Step by Step Solution
There are 3 Steps involved in it
1 Expert Approved Answer
Step: 1 Unlock

Question Has Been Solved by an Expert!
Get step-by-step solutions from verified subject matter experts
Step: 2 Unlock
Step: 3 Unlock