

Question: Using the data in the Excel file Demographics, determine if a linear relationship exists between unemployment rates and cost of living indexes by constructing a
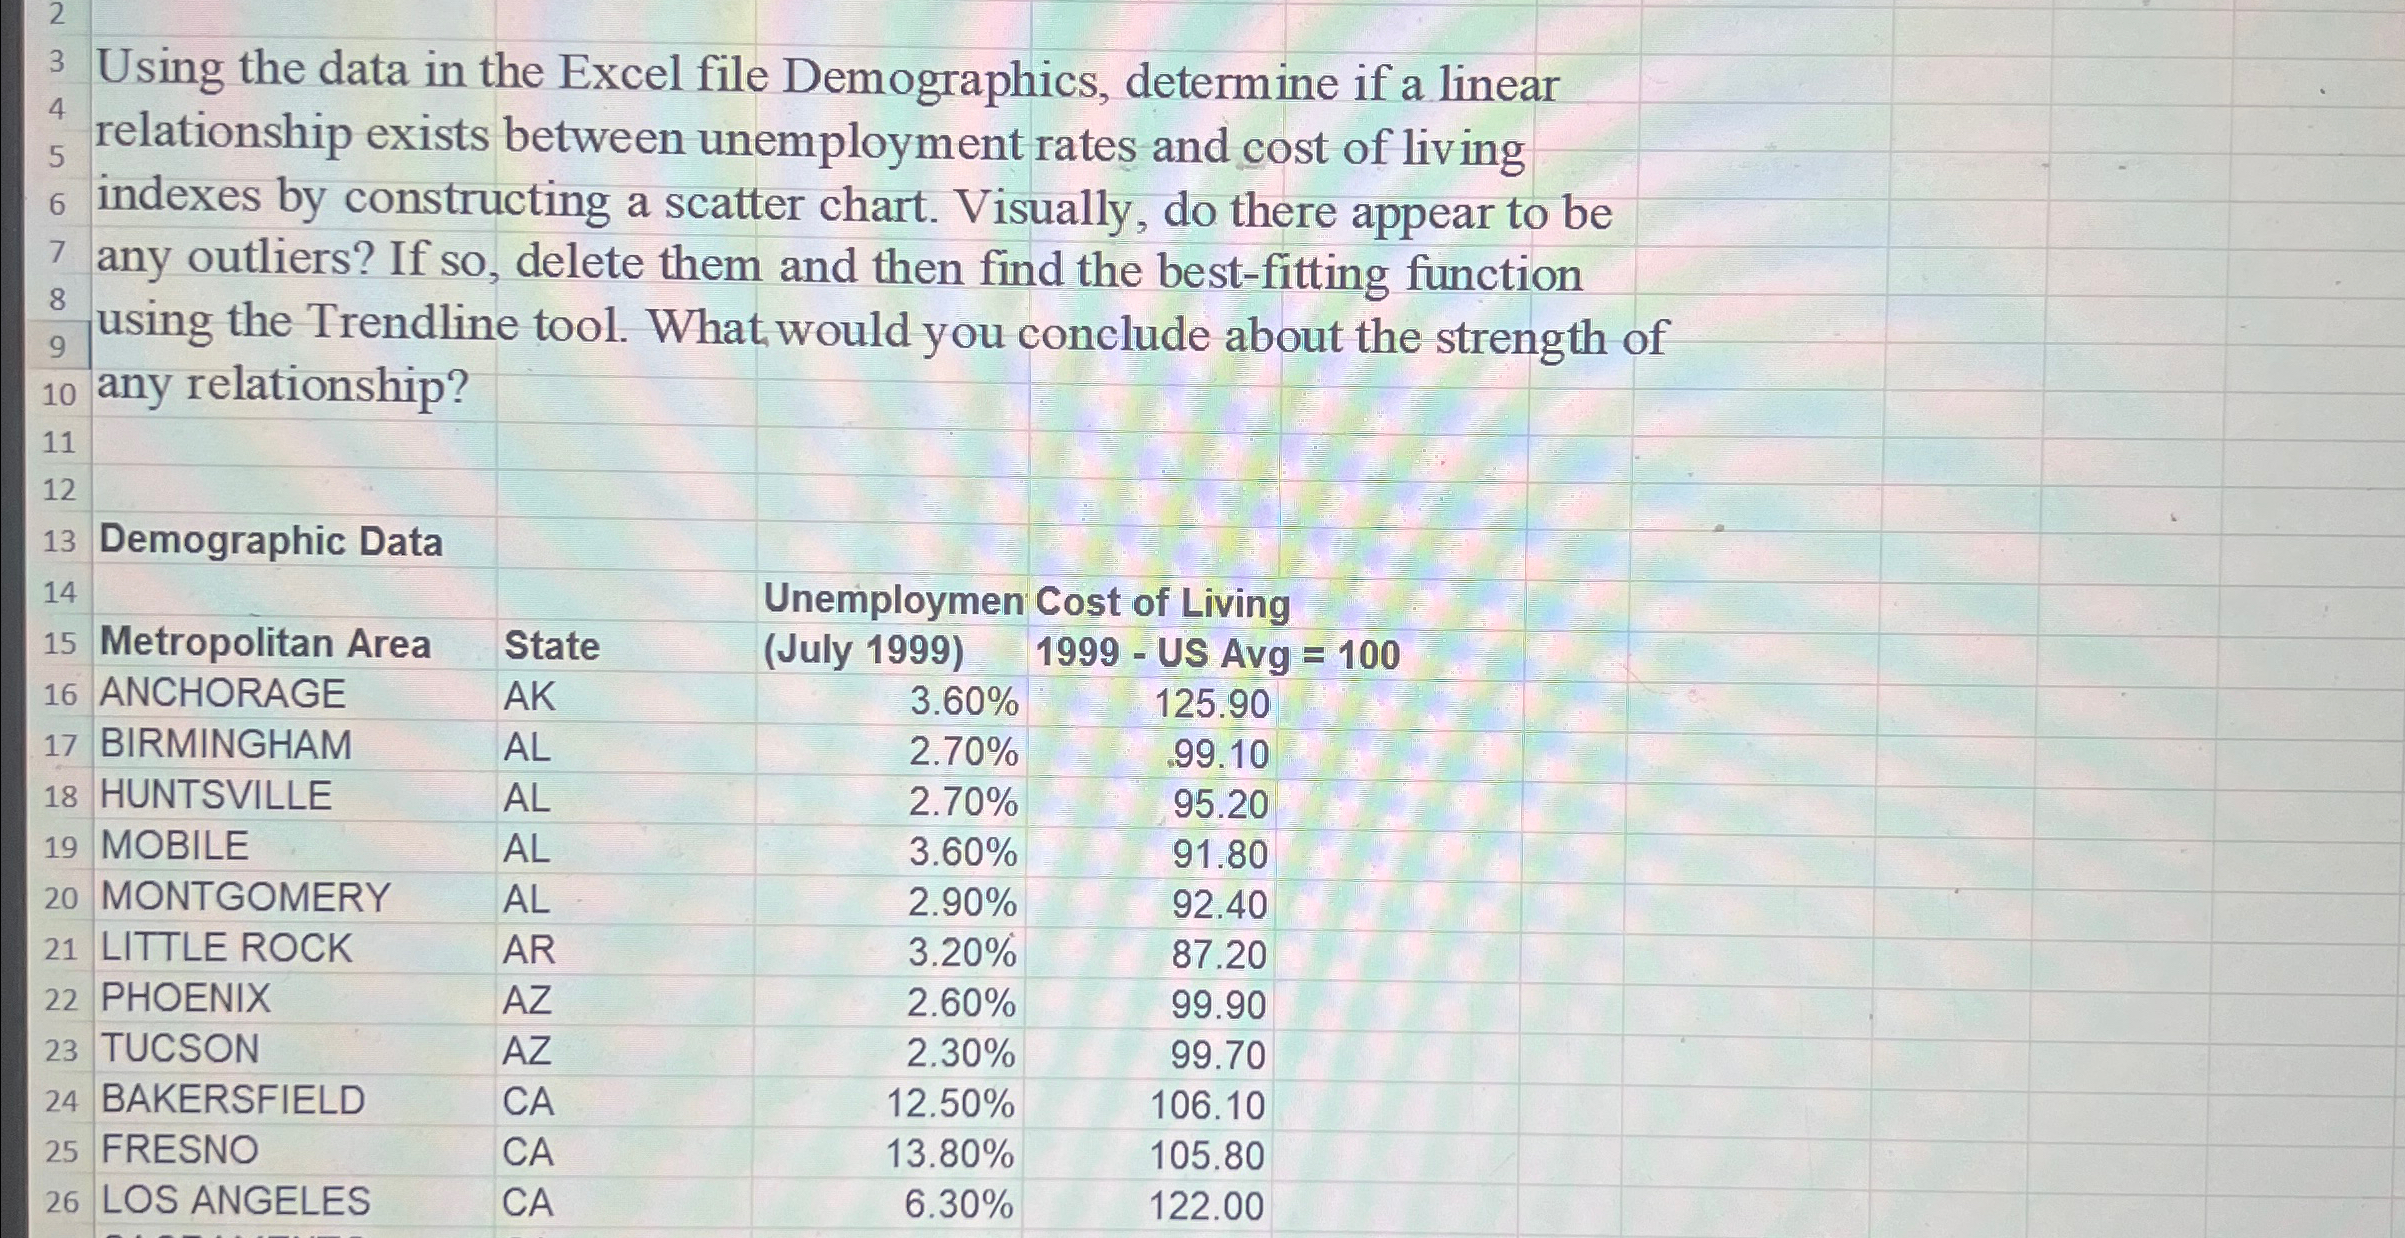
Using the data in the Excel file Demographics, determine if a linear relationship exists between unemployment rates and cost of living indexes by constructing a scatter chart. Visually, do there appear to be any outliers? If so delete them and then find the bestfitting function using the Trendline tool. What would you conclude about the strength of any relationship?
Demographic Data
tableMetropolitan Area,State,tableUnemploymen Cost of LivingJuly ANCHORAGEAKBIRMINGHAMALHUNTSVILLEALMOBILEALMONTGOMERYALLITTLE ROCK,ARPHOENIXAZTUCSONAZBAKERSFIELDCAFRESNOCALOS ANGELES,CA
Step by Step Solution
There are 3 Steps involved in it
1 Expert Approved Answer
Step: 1 Unlock

Question Has Been Solved by an Expert!
Get step-by-step solutions from verified subject matter experts
Step: 2 Unlock
Step: 3 Unlock