

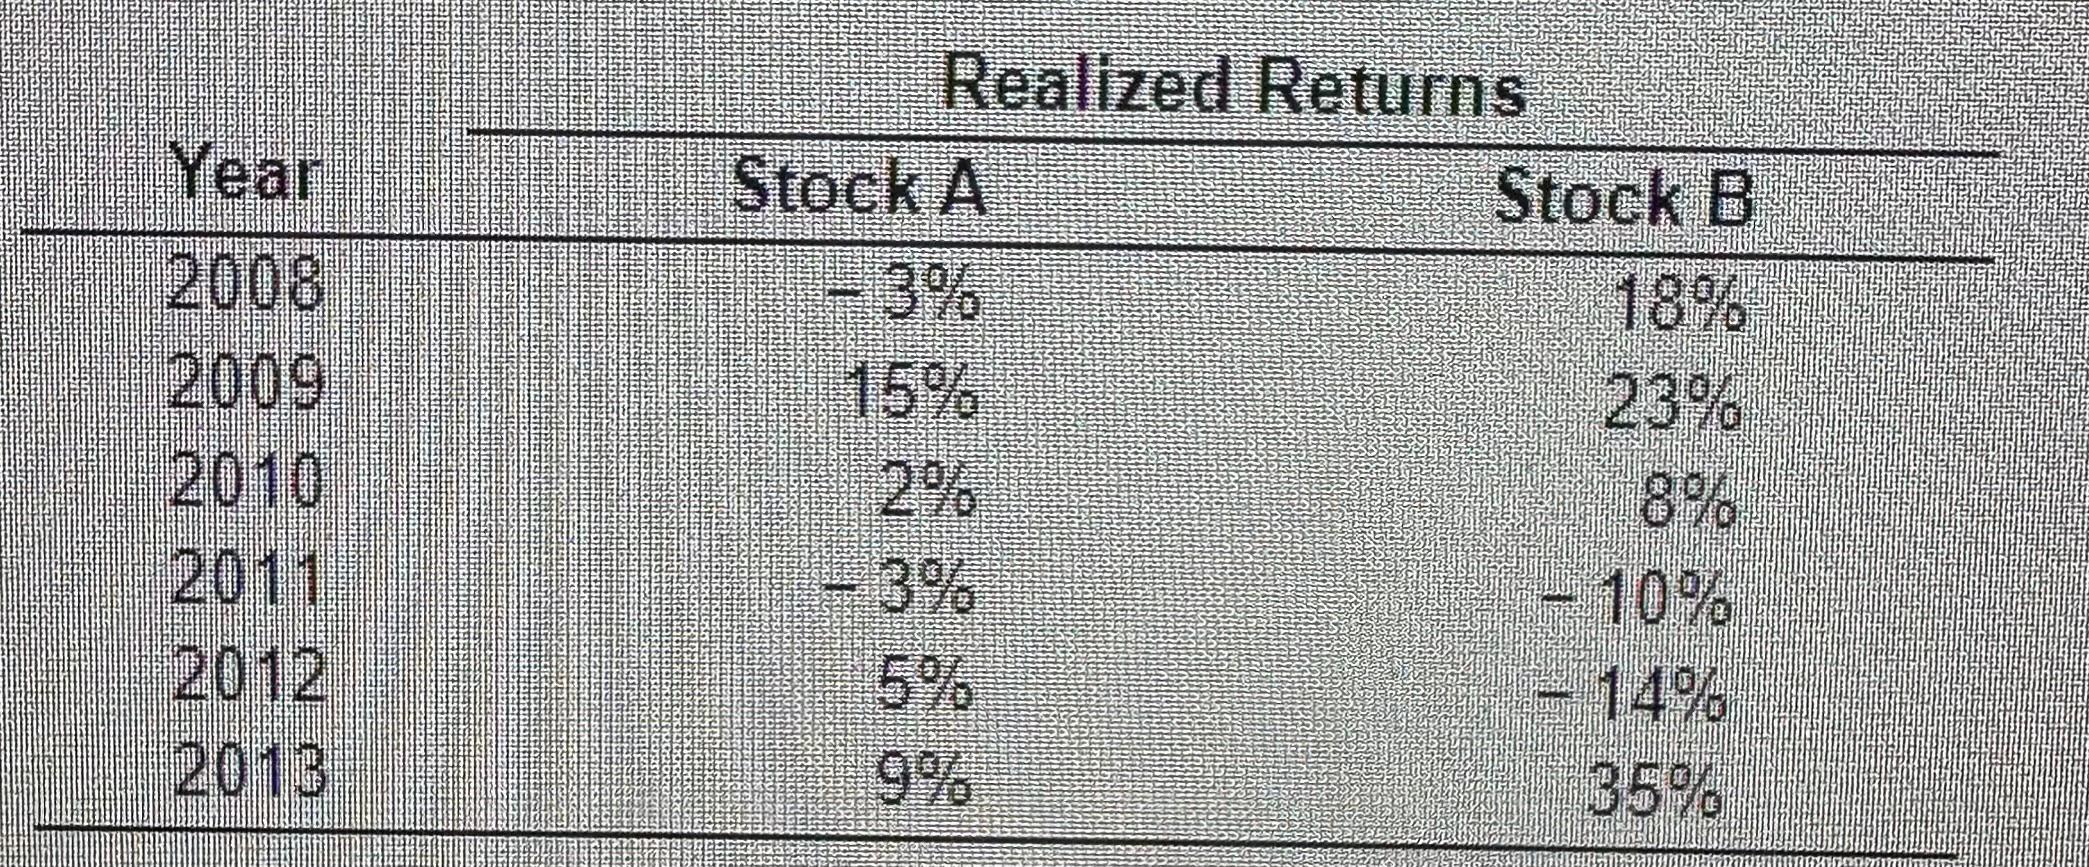
Question: Using the data in the following table, and the fact that the correlation of A and B is 0.49, calculate the volatility (standard deviation) of
Using the data in the following table, and the fact that the correlation of A and B is 0.49, calculate the volatility (standard deviation) of a portfolio that is
50% invested in stock A and 50% invested in stock B. (Click on the following icon in order to copy its contents into a spreadsheet.)
a) the standard deviation of the portfolio is ____% (round to three decimal)
\begin{tabular}{ccc} \multicolumn{2}{c}{ Realized Returns } \\ \cline { 2 - 3 } Year & Stock A \\ \hline 2008 & 3% & 18% \\ 2009 & 15% & 23% \\ 2010 & 2% & 8% \\ 2011 & 3% & 10% \\ 2012 & 5% & 14% \\ 2013 & 9% & 35% \\ \hline \end{tabular}
Step by Step Solution
There are 3 Steps involved in it
1 Expert Approved Answer
Step: 1 Unlock

Question Has Been Solved by an Expert!
Get step-by-step solutions from verified subject matter experts
Step: 2 Unlock
Step: 3 Unlock