

Question: Using the data in the following table, and the fact that the correlation of A and B is 0.20, calculate the volatility (standard deviation) of
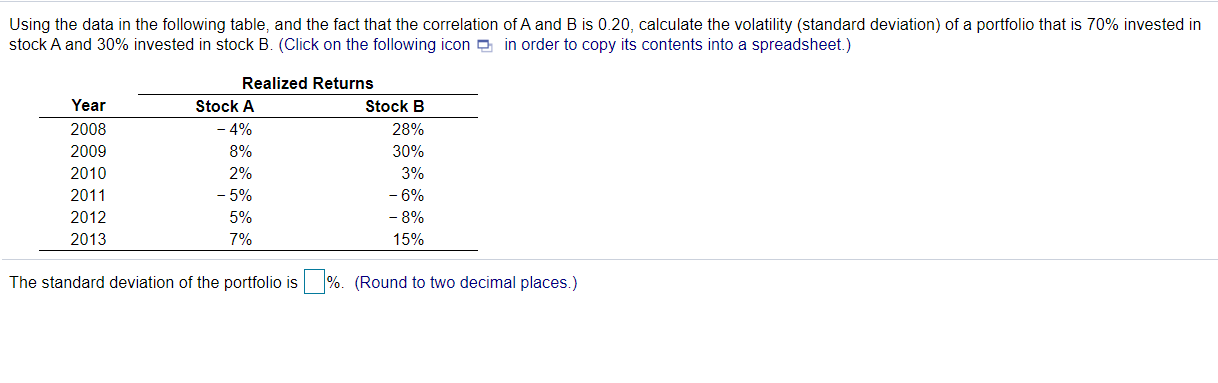
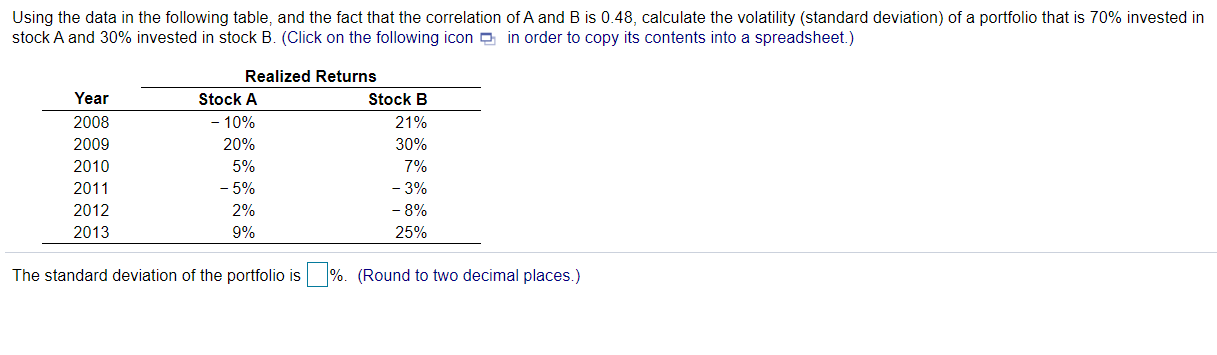
Using the data in the following table, and the fact that the correlation of A and B is 0.20, calculate the volatility (standard deviation) of a portfolio that is 70% invested in stock A and 30% invested in stock B. (Click on the following icon in order to copy its contents into a spreadsheet.) Year 2008 2009 2010 2011 2012 2013 Realized Returns Stock A Stock B 4% 28% 8% 30% 2% 3% - 5% -6% 5% 7% 15% -8% The standard deviation of the portfolio is %. (Round to two decimal places.) Using the data in the following table, and the fact that the correlation of A and B is 0.48, calculate the volatility (standard deviation) of a portfolio that is 70% invested in stock A and 30% invested in stock B. (Click on the following icon in order to copy its contents into a spreadsheet.) Year 2008 2009 2010 2011 2012 2013 Realized Returns Stock A Stock B 10% 21% 20% 30% 5% 7% -5% - 3% 2% - 8% 9% 25% The standard deviation of the portfolio is %. (Round to two decimal places.)
Step by Step Solution
There are 3 Steps involved in it

Get step-by-step solutions from verified subject matter experts