

Question: Using the data in the following table, calculate the return for investing in this stock from January 1 to December 31. Prices are after the
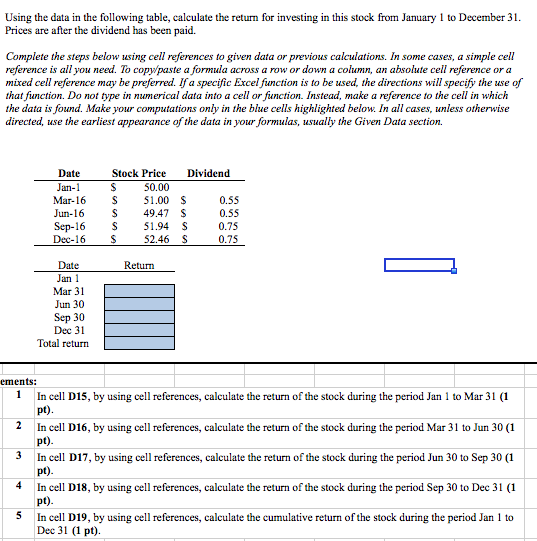
Using the data in the following table, calculate the return for investing in this stock from January 1 to December 31. Prices are after the dividend has been paid. Complete the steps below using cell references to given data or previous calculations. In some cases, a simple cell reference is all you need. To copy paste a formula across a row or down a column, an absolute cell reference or a mixed cell reference may be preferred. If a specific Excel function is to be used, the directions will specify the use of that function. Do not type in numerical data into a cell or function. Instead, make a reference to the cell in which the data is found. Make your computations only in the blue cells highlighted below. In all cases, unless otherwise directed, use the earliest appearance of the data in your formulas, usually the Given Data section. S Date Jan-1 Mar-16 Jun-16 Sep-16 Dec-16 Stock Price Dividend $ 50.00 51.00 $ 0.55 S 49.47 $ 0.55 S 51.94 S 0.75 $ 52.46 S 0.75 Return Date Jan 1 Mar 31 Jun 30 Sep 30 Dec 31 Total return ements: 1 In cell D15, by using cell references, calculate the return of the stock during the period Jan 1 to Mar 31 (1 pt). 2 In cell D16, by using cell references, calculate the return of the stock during the period Mar 31 to Jun 30 (1 pt). In cell 017, by using cell references, calculate the return of the stock during the period Jun 30 to Sep 30 (1 pt). In cell D18, by using cell references, calculate the return of the stock during the period Sep 30 to Dec 31 (1 pt). In cell D19, by using cell references, calculate the cumulative return of the stock during the period Jan 1 to Dec 31 (1 pt)
Step by Step Solution
There are 3 Steps involved in it

Get step-by-step solutions from verified subject matter experts