

Question: Using the data in the following table, calculate the volatility (standard deviation) of a portfolio that is 58% invested in stock A and 42%
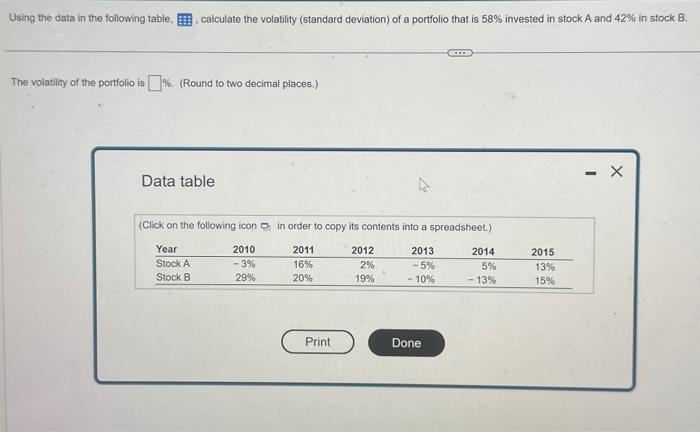
Using the data in the following table, calculate the volatility (standard deviation) of a portfolio that is 58% invested in stock A and 42% in stock B. The volatility of the portfolio is%. (Round to two decimal places.) Data table (Click on the following icon in order to copy its contents into a spreadsheet.) Year 2011 2013 Stock A 16% - 5% Stock B 20% - 10% 2010 -3% 29% Print 2012 2% 19% V Done 2014 5% - 13% 2015 13% 15% - X Using the data in the following table, calculate the volatility (standard deviation) of a portfolio that is 58% invested in stock A and 42% in stock B. The volatility of the portfolio is%. (Round to two decimal places.) Data table (Click on the following icon in order to copy its contents into a spreadsheet.) Year 2011 2013 Stock A 16% - 5% Stock B 20% - 10% 2010 -3% 29% Print 2012 2% 19% V Done 2014 5% - 13% 2015 13% 15% - X
Step by Step Solution
3.31 Rating (151 Votes )
There are 3 Steps involved in it
Expected Return of Portfolio Weight of A Return of A Weight of B Return of B 2010 Expected Retur... View full answer

Get step-by-step solutions from verified subject matter experts