

Question: Using the data in the following table, estimate the average return and volatility for each stock. (Click on the following icon in order to copy
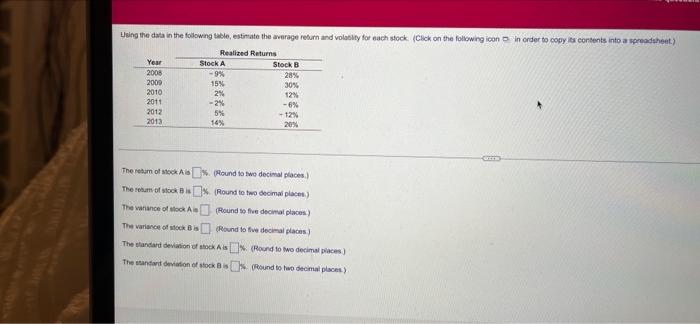
Using the data in the following table, estimate the average return and volatility for each stock. (Click on the following icon in order to copy its contents into a spreadsheet.) Realized Returns Year 2008 2009 2010 2011 2012 2013 Stock A -9% 15% 2% -2% 5% 14% Stock B 28% 30% 12% -6% -12% The return of stock Ais%. (Round to two decimal places) The return of stock Bis% (Round to two decimal places) The vanance of stock Ais (Round to five decimal places) (Round to five decimal places) The variance of stock B is The standard deviation of stock A is The standard deviation of stock Bis % (Round to two decimal places) (Round to two decimal places)
Step by Step Solution
There are 3 Steps involved in it
1 Expert Approved Answer
Step: 1 Unlock

Question Has Been Solved by an Expert!
Get step-by-step solutions from verified subject matter experts
Step: 2 Unlock
Step: 3 Unlock