

Question: Using the data in the May 5 tab excel spread sheet, is the average (mean) proportion of positive COVID cases to the number of people
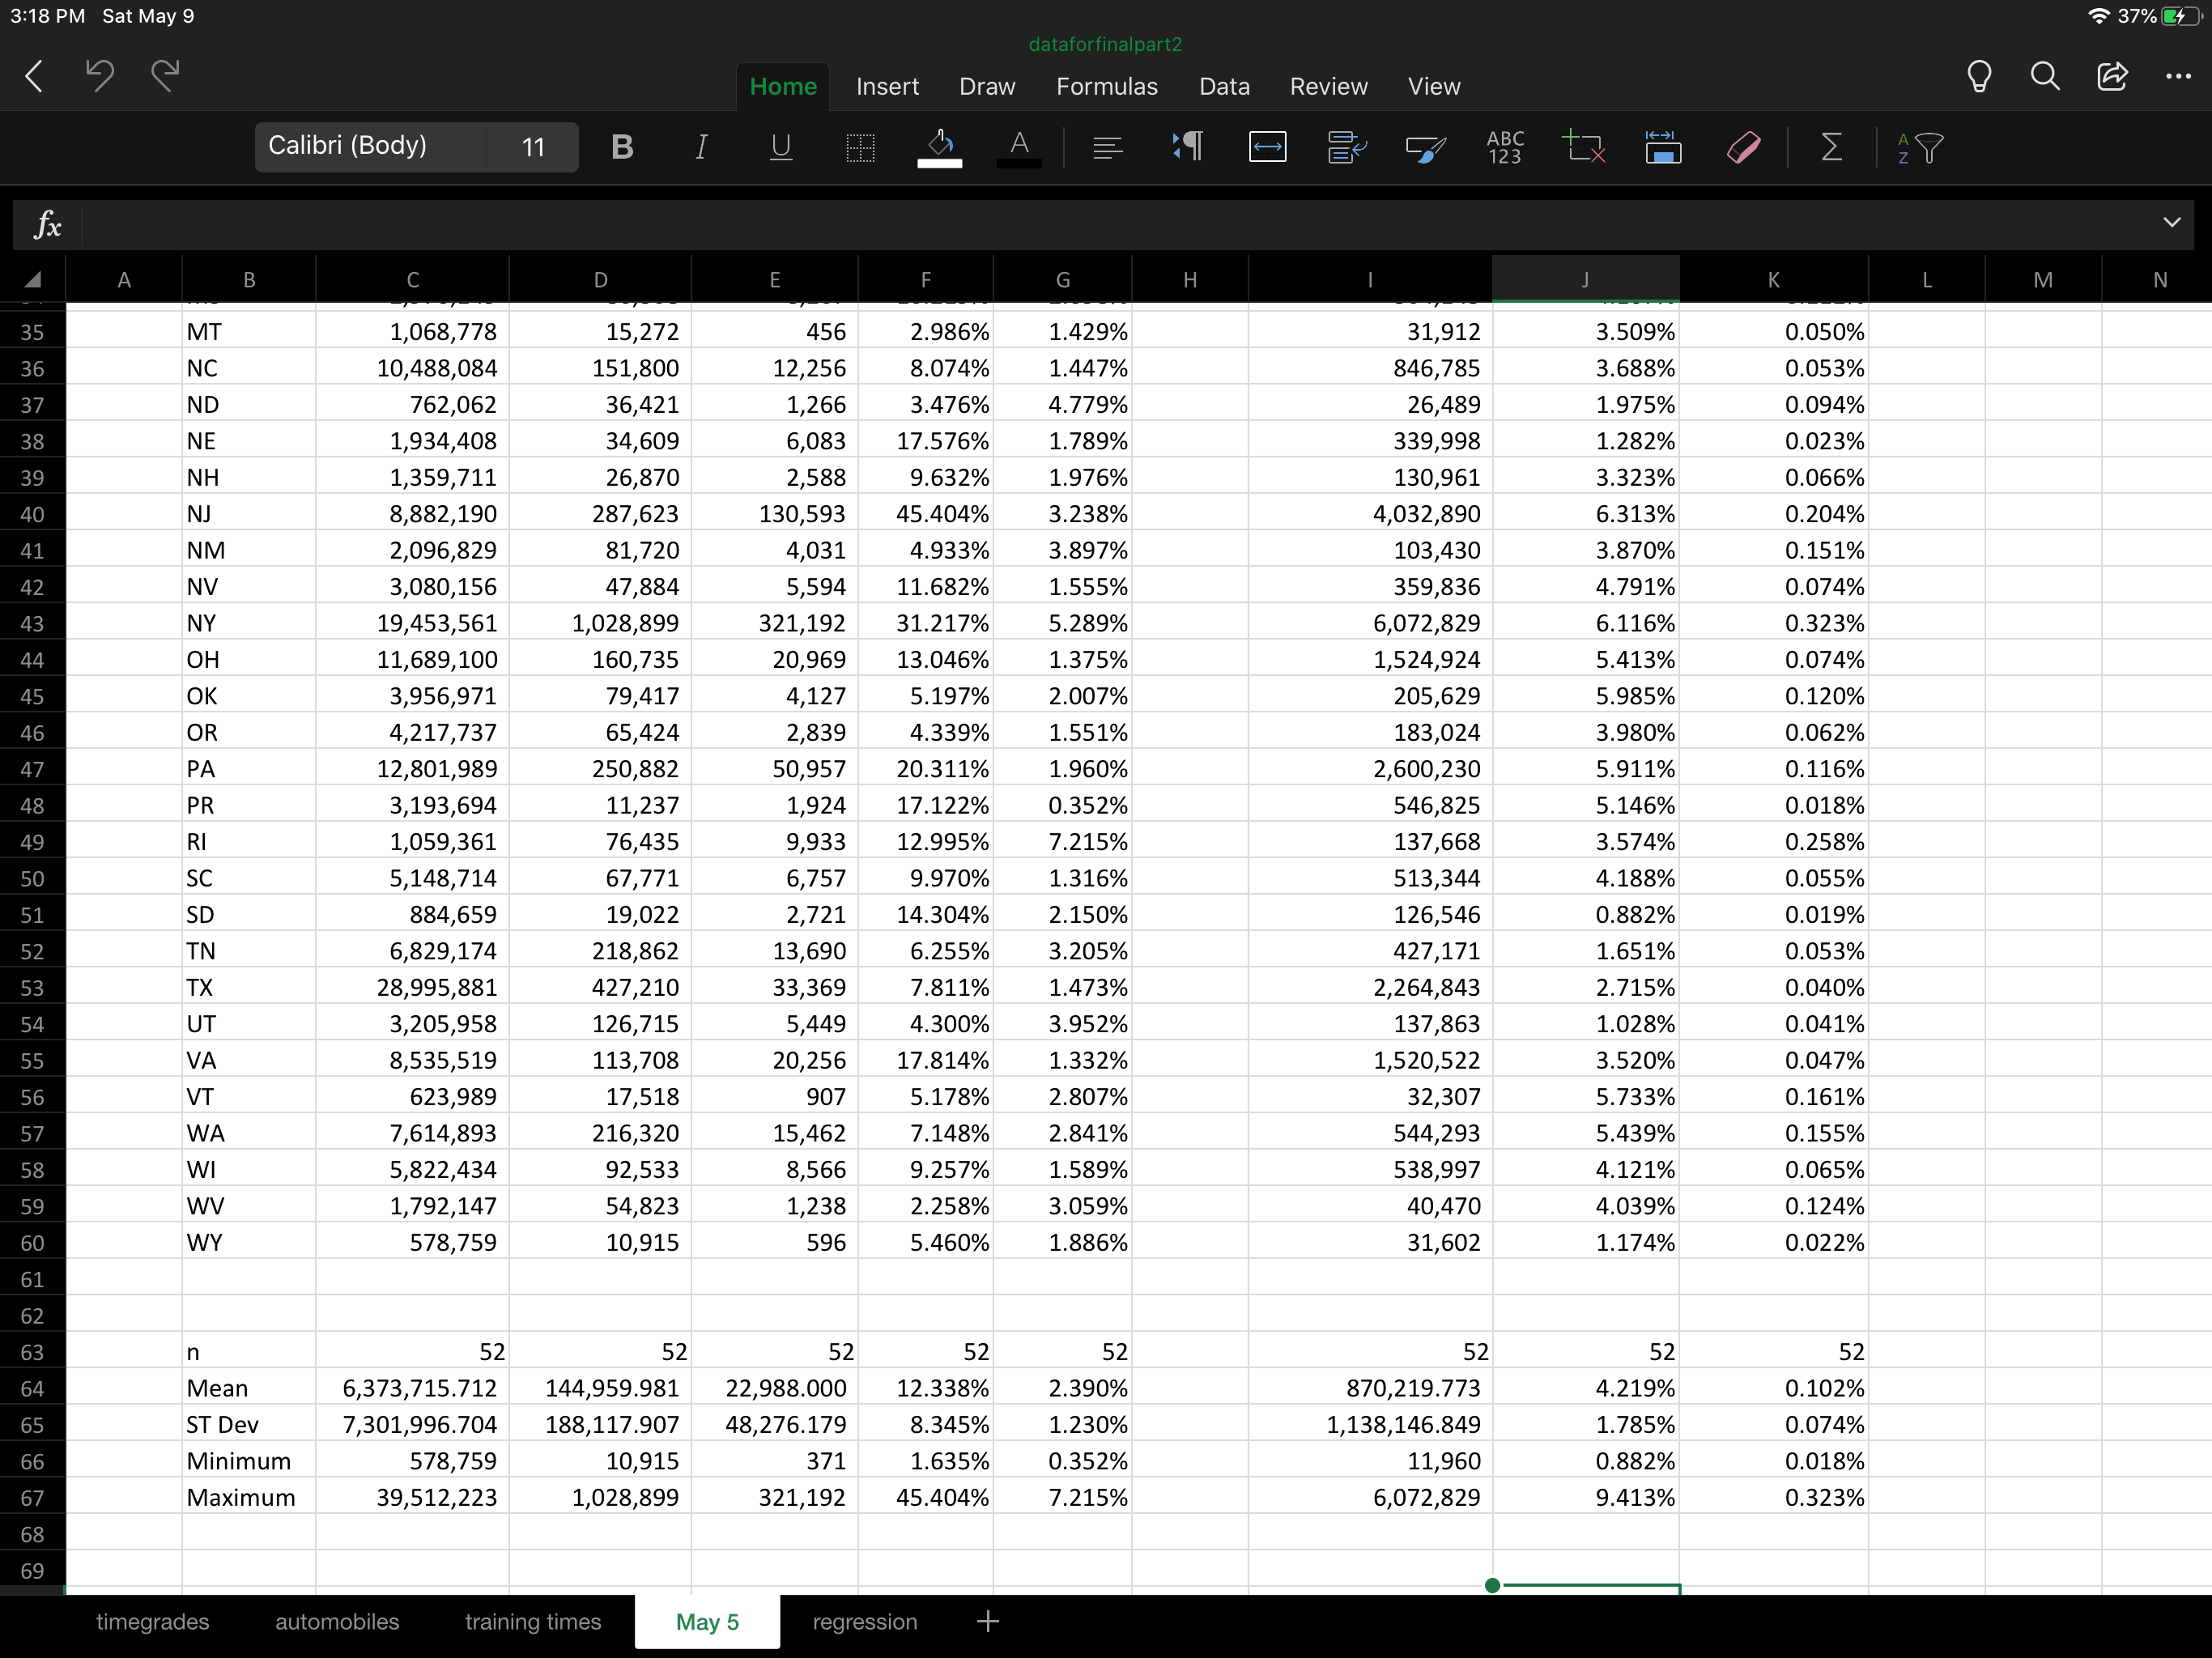
Using the data in the May 5 tab excel spread sheet, is the average (mean) proportion of positive COVID cases to the number of people tested in Hawaii the same as the National average proportion of National mean- 12.338% with a National Standard Deviation = 8.345%
Test at significance level = .01
I have my hypotheses as follows:
Ho: The local mean proportion of positive COVID cases tested to the number of people tested in Hawaii is = to the National Proportion.
Ha: The local mean proportion of positive COVID cases tested to the number of people tested in Hawaii is NOT = to the National Proportion.
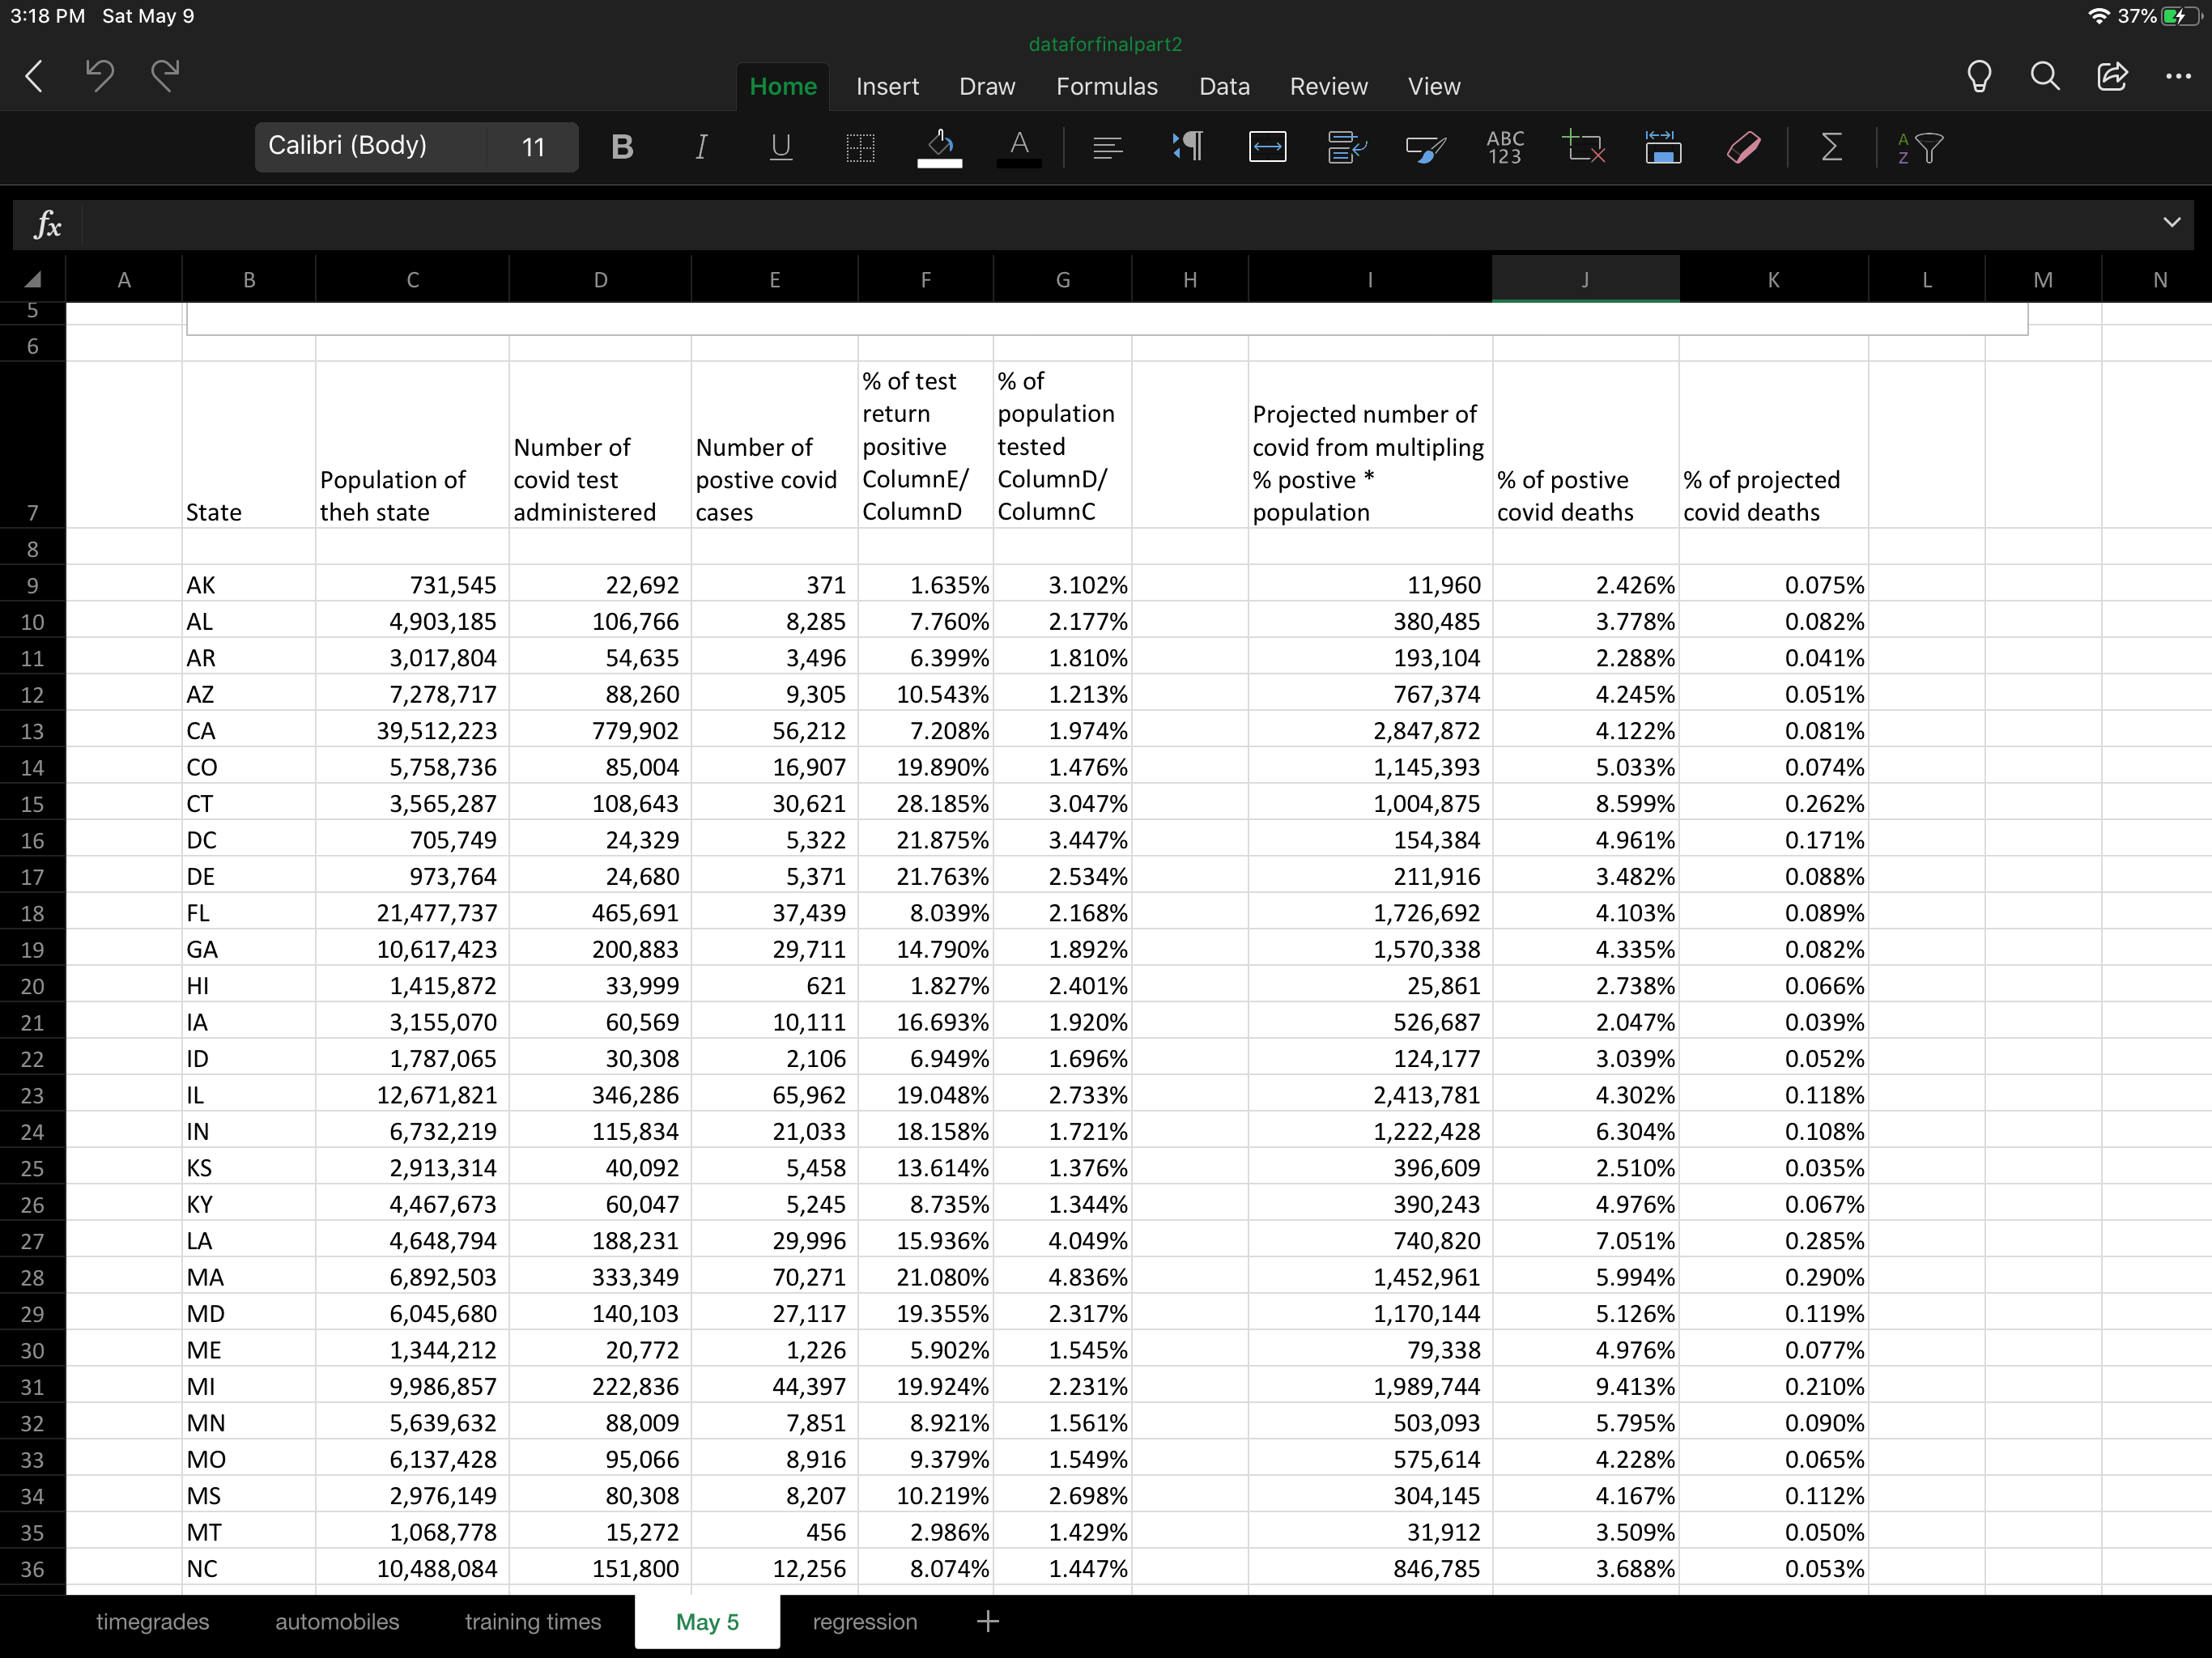
\f37% 3:18 PM Sat May 9 dataforfinalpart2 Insert Draw Formulas Calibri (Body) 11 B U fx E G H M B D % of test return population Projected number of Number of Number of positive tested covid from multipling Population of covid test postive covid ColumnE/ ColumnD/ % postive % of postive % of projected theh state administered cases ColumnD ColumnC population covid deaths covid deaths AK 731,545 22,692 371 1.635% 3.102% 11,960 2.426% 0.075% 4,903,185 7.760% 2.177% 3.778% 0.082% 10 AL 106,766 3,285 AR 3,017,804 54,635 3,496 6.399% 1.810% 193,104 2.288% AZ 7,278,717 88,260 9,305 10.543% 1.213% 767,374 4.245% CA 39,512,223 779,902 56,212 7.208% 1.974% 2,847,872 4.122% 0.081% co 5,758,736 85,004 16,907 19.890% 1,145,393 5.033% 0.074% 14 3,565,287 108,643 28.185% 3.599% 0.262% 15 CT 30,621 3.047% 1,004,875 16 DC 705,749 24,329 5 ,322 21.875% 3.447% 154,384 4.961% 0.171% DE 973,764 24,680 5,371 21.763% 2.534% 211,916 18 FL 21,477,737 465,691 8.039% 2.168% 1,726,692 4.103% 0.089% GA 10,617,423 200,883 29,711 14.790% 1.892% 1,570,338 4.335% 0.082% 19 20 HI 1,415,872 33,999 62 1.827% 2.401% 25,861 2.738% IA 3,155,070 60,569 10,111 16.693% 1.920% 526,687 2.047% 22 ID 1,787,065 30,308 2,106 6.949% 1.696% 124,177 3.039% 0.052% IL 12,671,821 346,286 65,962 19.048% 2,413,781 4.302% 0.118% 23 24 IN 6,732,219 115,834 21,033 18.158% 1.721% 1,222,428 5.304% 0.108% 25 KS 2,913,314 40,092 5,458 13.614% 1.376% 396,609 26 KY 4,467,673 60,047 5,245 8.735% 1.344% 390,243 0.285% 27 LA 4,648,794 188,231 29,996 15.936% 4.049% 740,820 7.051% 28 6,892,503 70,271 21.080% 4.836% 1,452,961 5.994% 0.290% 29 MD 6,045,680 140,103 19.355% 2.317% 1,170,144 5.126% 0.119% 30 ME 1,344,212 20,772 1,226 5.902% 1.545% 79,338 4.976% 31 MI 9,986,857 44,397 19.924% 2.231% 1,989,744 9.413% 0.210% 5.795% 0.090% 32 5,639,632 88,009 7,851 8.921% 503,093 33 MO 6,137,428 95,066 3,916 9.379% 1.549% 575,614 4.228% .065% 4.167% 34 MS 2,976,149 80,308 3,207 10.219% 2.698% 304,145 MT 1,068,778 15,272 456 2.986% 1.429% 31,912 3.509% NC 10,488,084 151,800 8.074% 1.447% 846,785 0.053% automobiles training times May 5 regression
Step by Step Solution
There are 3 Steps involved in it

Get step-by-step solutions from verified subject matter experts