

Question: Using the data in the picture provided along with the listed scenario, please provide specific step-by-step instructions on how to compute a null hypothesis test
Using the data in the picture provided along with the listed scenario, please provide specific step-by-step instructions on how to compute a null hypothesis test and an alternative hypothesis test using EXCEL for Apple and Google.
Also, Generate a box plot for each test using EXCEL.
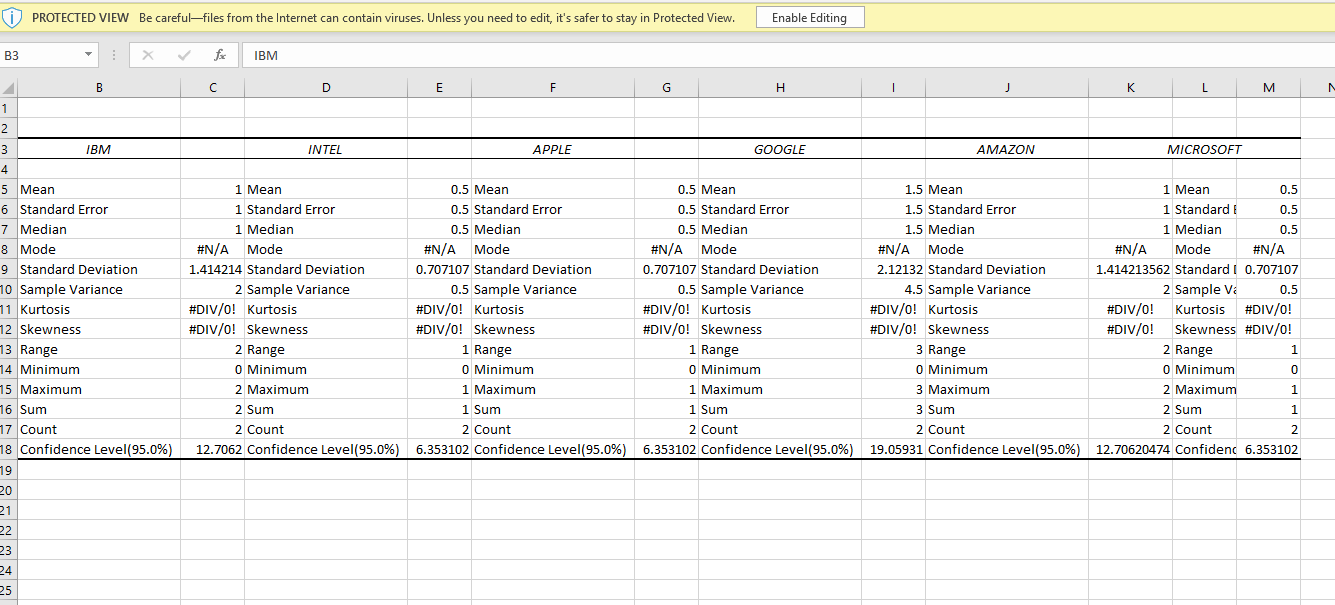
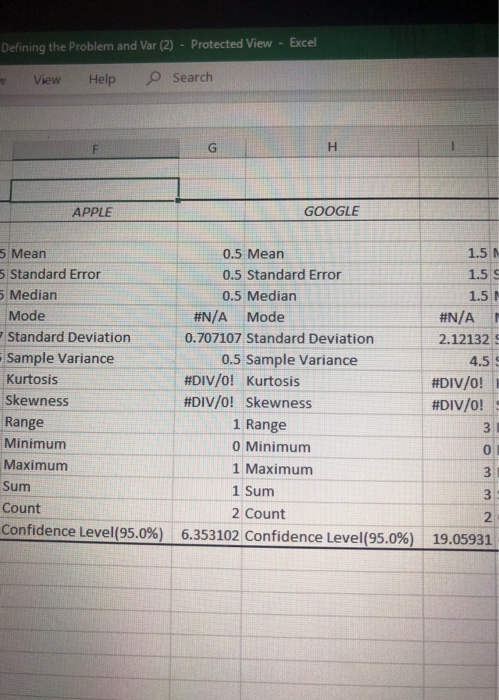
Data for Apple:
- Mean 0.5
- Standard Error 0.5
- Median 0.5
- Mode #N/A
- Standard Deviation 0.707107
- Sample Variance 0.5
- Kurtosis #DIV/0!
- Skewness #DIV/0!
- Range 1
- Minimum 0
- Maximum 1
- Sum 1
- Count 2
- Confidence Level(95.0%) 6.353102
Data for Google:
- Mean 1.5
- Standard Error 1.5
- Median 1.5
- Mode #N/A
- Standard Deviation 2.12132
- Sample Variance 4.5
- Kurtosis #DIV/0!
- Skewness #DIV/0!
- Range 3
- Minimum 0
- Maximum 3
- Sum 3
- Count 2
- Confidence Level(95.0%) 19.05931
Scenario: The Age Discrimination in Employment Act of 1967 (ADEA) protects certain applicants and employees 40 years of age and older from discrimination on the basis of age in hiring, promotion, discharge, compensation, or terms, conditions or privileges of employment. Review "The Age Discrimination in Employment Act of 1967" and "Intel Accused of Age Discrimination" study materials to gain further background information on this topic.
Your team has been tasked with investigating age discrimination allegations in the high technology industry. The companies Intel, IBM, Apple, Google, Microsoft, and Amazon were chose to investigate and explore whether gender, type of education, salary, or physical locations are factors related to age discrimination. The data collection below is from the past 6 periods (e.g., months, seasons, years) for Apple and Google.
PROTECTED VIEW Be careful-files from the Internet can contain viruses. Unless you need to edit, it's safer to stay in Protected View. Enable Editing B3 X V IBM B C D E F G H J K L M 2 W BM INTEL APPLE GOOGLE AMAZON MICROSOFT Mean 1 Mean 0.5 Mean 0.5 Mean 1.5 Mean 1 Mean 0.5 6 Standard Error 1 Standard Error 0.5 Standard Error 0.5 Standard Error 1.5 Standard Error 1 Standard 0.5 Median 1 Median 0.5 Median 0.5 Median 1.5 Median 1 Median 0.5 8 Mode #N/A Mode #N/A Mode #N/A Mode #N/A Mode #N/A Mode #N/A 9 Standard Deviation 1.414214 Standard Deviation 0.707107 Standard Deviation 0.707107 Standard Deviation 2.12132 Standard Deviation 1.414213562 Standard [ 0.707107 10 Sample Variance 2 Sample Variance 0.5 Sample Variance 0.5 Sample Variance 4.5 Sample Variance 2 Sample Va 0.5 11 Kurtosis #DIV/0! Kurtosis #DIV/0! Kurtosis #DIV/0! Kurtosis #DIV/0! Kurtosis #DIV/O! Kurtosis #DIV/O! 12 Skewness #DIV/0! Skewness #DIV/0! Skewness #DIV/0! Skewness #DIV/0! Skewness #DIV/O! Skewness #DIV/0! 13 Range 2 Range 1 Range 1 Range 3 Range 2 Range 4 Minimum 0 Minimum 0 Minimum 0 Minimum 0 Minimum 0 Minimum 15 Maximum 2 Maximum 1 Maximum 1 Maximum 3 Maximum 2 Maximum 16 Sum 2 Sum 1 Sum 1 Sum 3 Sum 2 Sum -HOH Count 2 Count 2 Count 2 Count 2 Count 2 Count 8 Confidence Level(95.0%) 12.7062 Confidence Level(95.0%) 6.353102 Confidence Level(95.0%) 6.353102 Confidence Level(95.0%) 19.05931 Confidence Level(95.0%) 12.70620474 Confidence 6.353102 9 3 24Defining the Problem and Var (2) - Protected View - Excel View Help Search G H APPLE GOOGLE 5 Mean 0.5 Mean 1.5 5 Standard Error 0.5 Standard Error 1.5 S Median 0.5 Median 1.5 Mode #N/A Mode #N/A Standard Deviation 0.707107 Standard Deviation 2.12132 Sample Variance 0.5 Sample Variance 4.5 Kurtosis #DIV/O! Kurtosis #DIV/O! Skewness #DIV/O! Skewness #DIV/O! Range 1 Range 3 Minimum 0 Minimum 0 Maximum 1 Maximum 3 Sum 1 Sum 3 Count 2 Count 2 Confidence Level(95.0%) 6.353102 Confidence Level(95.0%) 19.05931
Step by Step Solution
There are 3 Steps involved in it

Get step-by-step solutions from verified subject matter experts