

Question: Using the data in the table B a. What was the average annual return of Microsoft stock from 2005-2017? b. What was the annual volatility
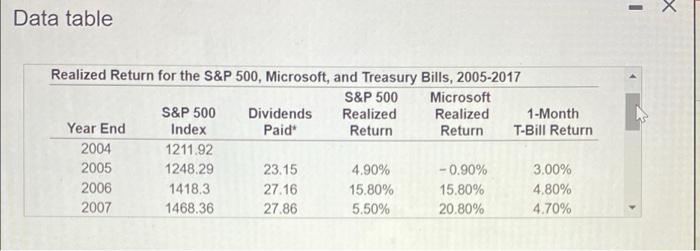
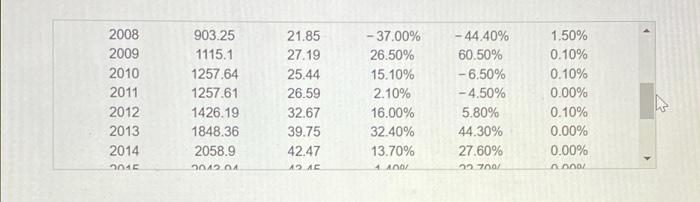
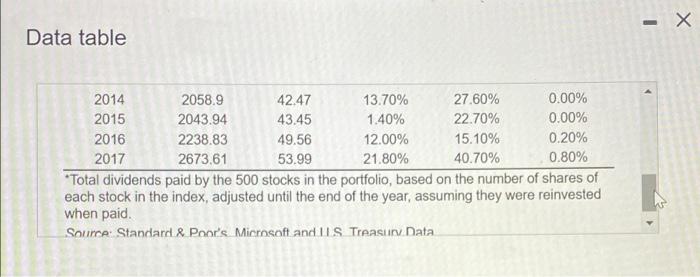
Using the data in the table B a. What was the average annual return of Microsoft stock from 2005-2017? b. What was the annual volatility for Microsoft stock from 2005-2017? a. What was the average annual return of Microsoft stock from 2005-2017? The average annual return is %. (Round to two decimal places.) b. What was the annual volatility for Microsoft stock from 2005-2017? - Data table Realized Return for the S&P 500, Microsoft, and Treasury Bills, 2005-2017 S&P 500 Microsoft S&P 500 Dividends Realized Realized 1-Month Year End Index Paid Return Return T-Bill Return 2004 1211.92 2005 1248.29 23.15 4.90% -0.90% 3.00% 2006 1418.3 27.16 15.80% 15.80% 4.80% 2007 1468.36 27.86 5.50% 20.80% 4.70% 2008 2009 2010 2011 2012 2013 2014 04 903.25 1115.1 1257.64 1257.61 1426.19 1848.36 2058.9 201204 21.85 27.19 25.44 26.59 32.67 39.75 42.47 AE - 37.00% 26.50% 15.10% 2.10% 16.00% 32.40% 13.70% - 44.40% 60.50% -6.50% -4.50% 5.80% 44.30% 27.60% 2700/ 1.50% 0.10% 0.10% 0.00% 0.10% 0.00% 0.00% DO 1. An Data table 2014 2058.9 42.47 13.70% 27.60% 0.00% 2015 2043.94 43.45 1.40% 22.70% 0.00% 2016 2238.83 49.56 12.00% 15.10% 0,20% 2017 2673.61 53.99 21.80% 40.70% 0.80% *Total dividends paid by the 500 stocks in the portfolio, based on the number of shares of each stock in the index, adjusted until the end of the year, assuming they were reinvested when paid. Source: Standard & Poor's Microsoft and ILS Treasury Data a. What was the average annual return of Microsoft stock from 2005-2017? The average annual return is % (Round to two decimal places.) b. What was the annual volatility for Microsoft stock from 2005-2017? The annual volatility of returns is N%, (Round to two decimal places.)
Step by Step Solution
There are 3 Steps involved in it

Get step-by-step solutions from verified subject matter experts