

Question: Analyze output. What do the measures tell you? Is your data skewed? Does it exhibit kurtosis? What is the interquartile range? What insights about the
Analyze output. What do the measures tell you? Is your data skewed? Does it exhibit kurtosis? What is the interquartile range?
- What insights about the data you have chosen do you derive from this analysis?

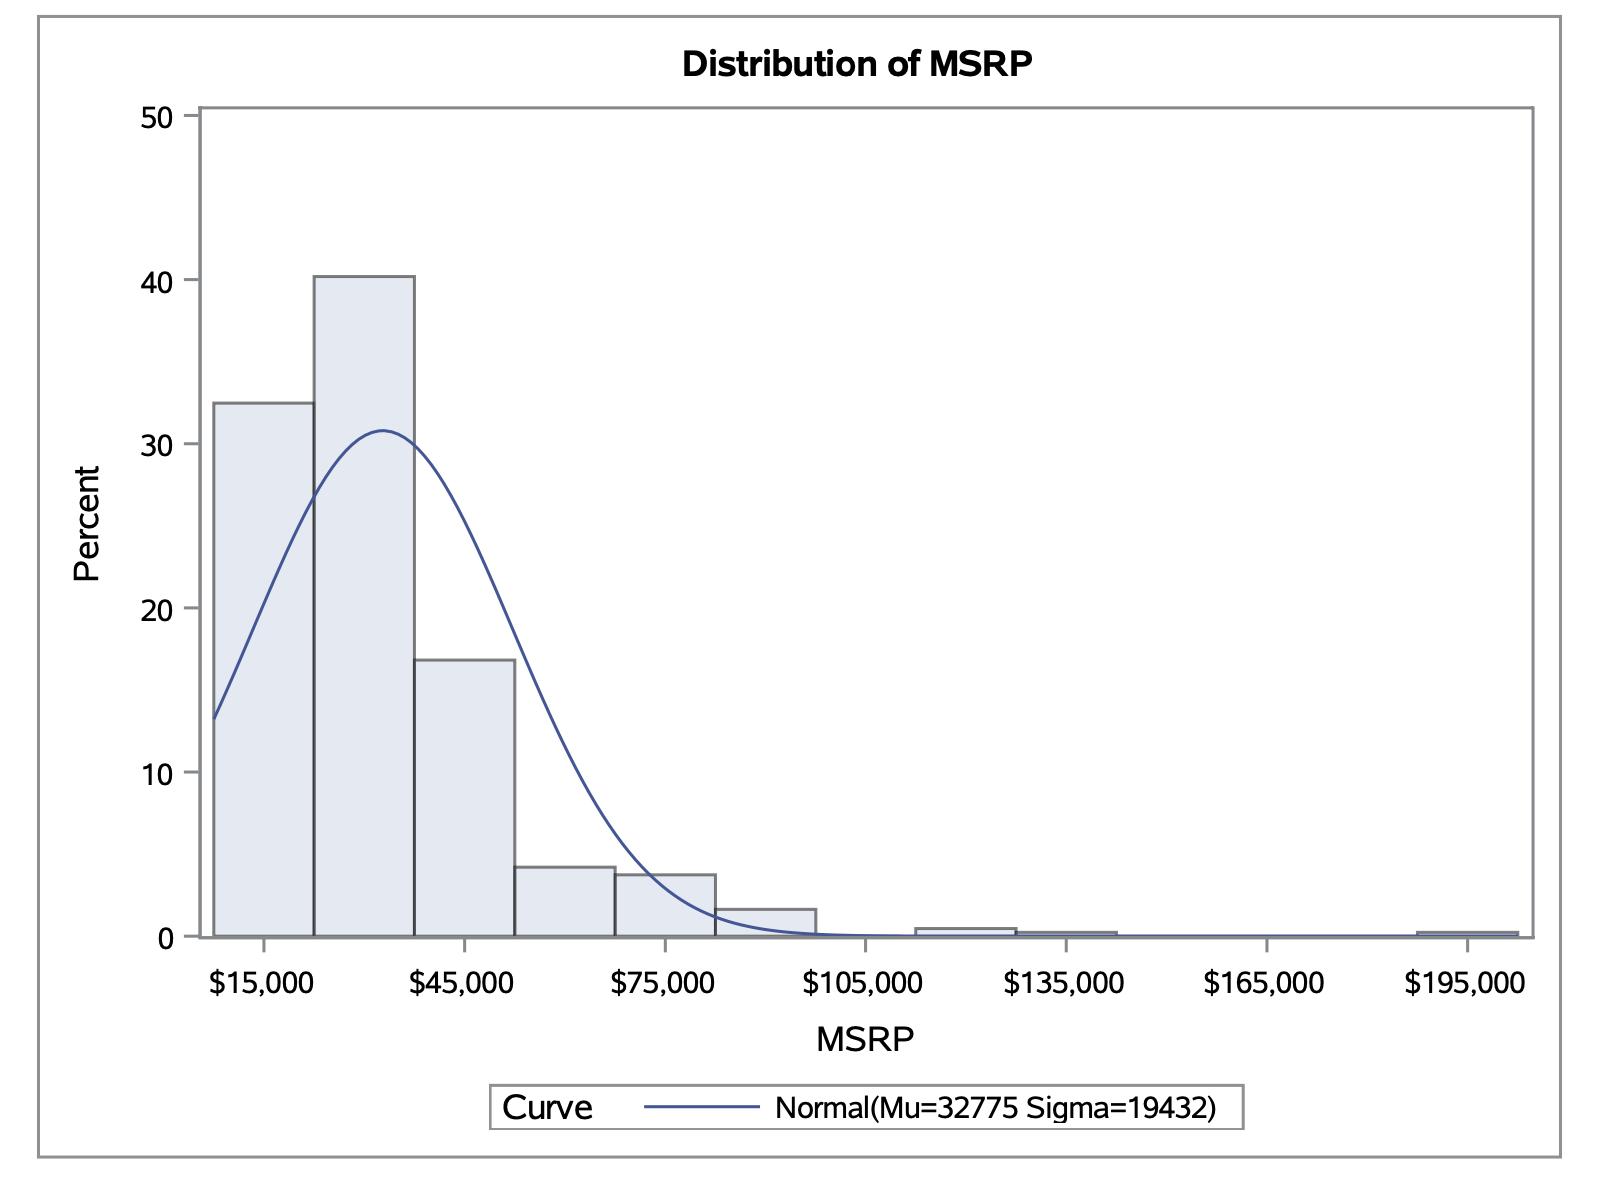
Percent 50 40 30 20 10 0 $15,000 $45,000 Curve Distribution of MSRP $75,000 $105,000 MSRP $135,000 $165,000 $195,000 Normal (Mu=32775 Sigma-19432)
Step by Step Solution
There are 3 Steps involved in it
1 Expert Approved Answer
Step: 1 Unlock

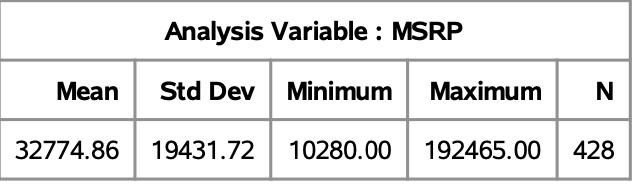
The distribution of MSRP in the image is skewed to the left The median is 3277486 while the interqua... View full answer
Question Has Been Solved by an Expert!
Get step-by-step solutions from verified subject matter experts
Step: 2 Unlock
Step: 3 Unlock