

Question: Using the data on returns for Contrafund, along with the SP500 returns, compute the Sharpe and information ratios for Contrafund, assuming that the SP500 is
Using the data on returns for Contrafund, along with the SP500 returns, compute the Sharpe and information ratios for Contrafund, assuming that the SP500 is an appropriate benchmark (use as many data points as you have observations on both for).
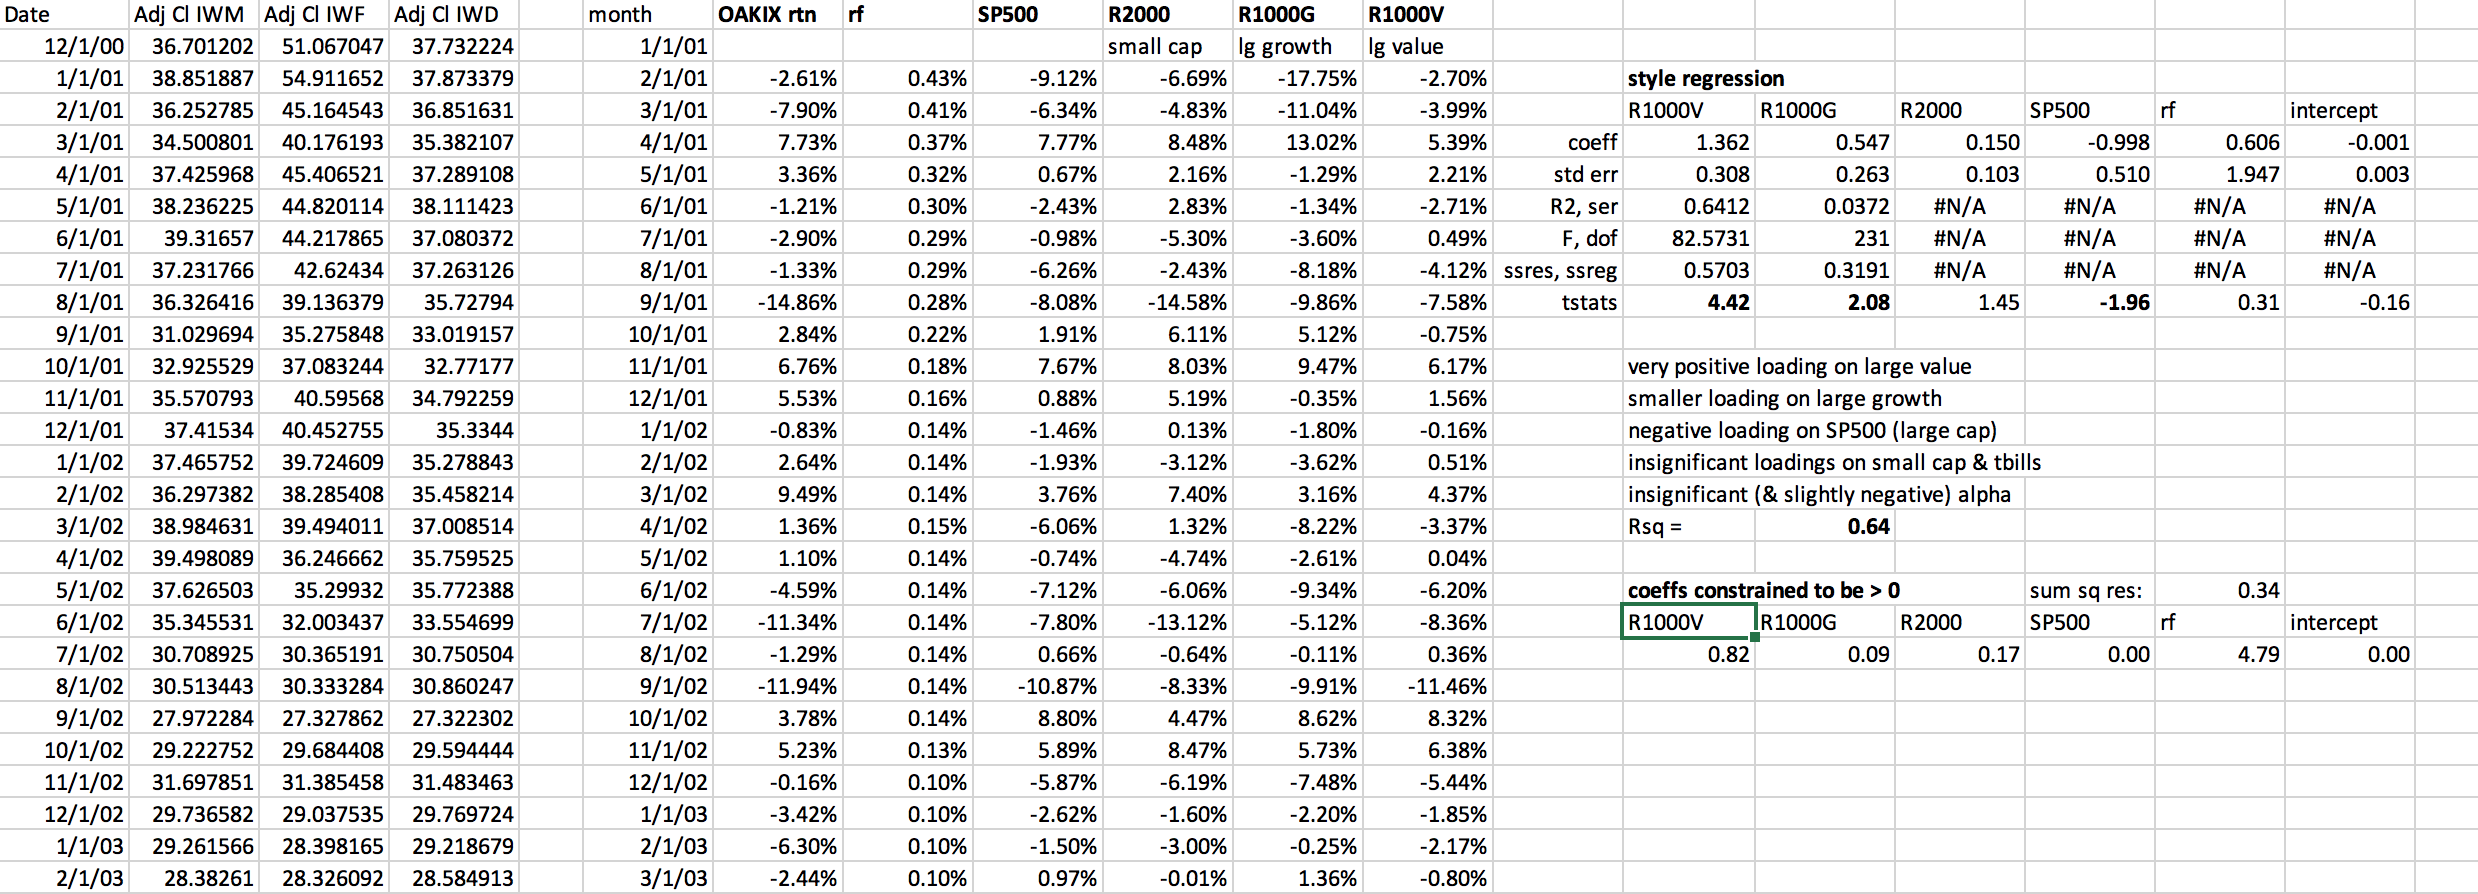
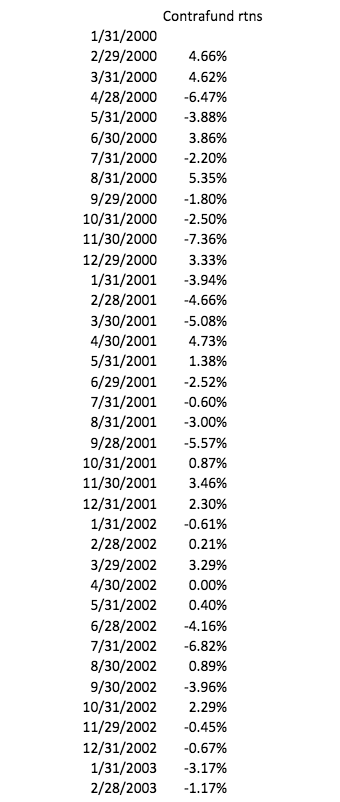
small cap rf 0.606 1.947 #N/A #N/A #N/A 0.31 intercept -0.001 0.003 #N/A #N/A #N/A -0.16 Date Adj CIWM Adj CI IWF Adj CIWD 12/1/00 36.701202 51.067047 37.732224 1/1/01 38.851887 54.911652 37.873379 2/1/01 36.252785 45.164543 36.851631 3/1/01 34.500801 40.176193 35.382107 4/1/01 37.425968 45.406521 37.289108 5/1/01 38.236225 44.820114 38.111423 6/1/01 39.31657 44.217865 37.080372 7/1/01 37.231766 42.62434 37.263126 8/1/01 36.326416 39.136379 35.72794 9/1/01 31.029694 35.275848 33.019157 10/1/01 32.925529 37.083244 32.77177 11/1/01 35.570793 40.59568 34.792259 12/1/01 37.41534 40.452755 35.3344 1/1/02 37.465752 39.724609 35.278843 2/1/02 36.297382 38.285408 35.458214 3/1/02 38.984631 39.494011 37.008514 4/1/02 39.498089 36.246662 35.759525 5/1/02 37.626503 35.29932 35.772388 6/1/02 35.345531 32.003437 33.554699 7/1/02 30.708925 30.365191 30.750504 8/1/02 30.513443 30.333284 30.860247 9/1/02 27.972284 27.327862 27.322302 10/1/02 29.222752 29.684408 29.594444 11/1/02 31.697851 31.385458 31.483463 12/1/02 29.736582 29.037535 29.769724 1/1/03 29.261566 28.398165 29.218679 2/1/03 28.38261 28.326092 28.584913 month OAKIX rtn rf 1/1/01 2/1/01 -2.61% 3/1/01 -7.90% 4/1/01 7.73% 5/1/01 3.36% 6/1/01 -1.21% 7/1/01 -2.90% 8/1/01 -1.33% 9/1/01 -14.86% 10/1/01 2.84% 11/1/01 6.76% 12/1/01 5.53% 1/1/02 -0.83% 2/1/02 2.64% 3/1/02 9.49% 4/1/02 1.36% 5/1/02 1.10% 6/1/02 -4.59% 7/1/02 -11.34% 8/1/02 -1.29% 9/1/02 -11.94% 10/1/02 3.78% 11/1/02 5.23% 12/1/02 -0.16% 1/1/03 -3.42% 2/1/03 -6.30% 3/1/03 -2.44% SP500 R2000 R1000G R1000V lg growth lg value 0.43% -9.12% -6.69% -17.75% -2.70% style regression 0.41% -6.34% -4.83% - 11.04% -3.99% R 1000V R 1000G R2000 SP500 0.37% 7.77% 8.48% 13.02% 5.39% coeff 1.362 0.547 0.150 -0.998 0.32% 0.67% 2.16% -1.29% 2.21% std err 0.308 0.263 0.103 0.510 0.30% -2.43% 2.83% -1.34% -2.71% R2, ser 0.6412 0.0372 #N/A #N/A 0.29% -0.98% -5.30% -3.60% 0.49% F, dof 82.5731 231 #N/A #N/A 0.29% -6.26% -2.43% -8.18% -4.12% ssres, ssreg 0.5703 0.3191 #N/A #N/A 0.28% -8.08% -14.58% -9.86% -7.58% tstats 4.42 2.08 1.45 -1.96 0.22% 1.91% 6.11% 5.12% -0.75% 0.18% 7.67% 8.03% 9.47% 6.17% very positive loading on large value 0.16% 0.88% 5.19% -0.35% 1.56% smaller loading on large growth 0.14% -1.46% 0.13% -1.80% -0.16% negative loading on SP500 (large cap) 0.14% -1.93% -3.12% -3.62% 0.51% insignificant loadings on small cap & tbills 0.14% 3.76% 7.40% 3.16% 4.37% insignificant (& slightly negative) alpha 0.15% -6.06% 1.32% -8.22% -3.37% Rsq = 0.64 0.14% -0.74% -4.74% -2.61% 0.04% 0.14% -7.12% -6.06% -9.34% -6.20% coeffs constrained to be > 0 sum sq res: 0.14% -7.80% -13.12% -5.12% -8.36% R 1000V IR1000G R2000 SP500 0.14% 0.66% -0.64% -0.11% 0.36% 0.82 0.09 0.17 0.00 0.14% -10.87% -8.33% -9.91% -11.46% 0.14% 8.80% 4.47% 8.62% 8.32% 0.13% 5.89% 8.47% 5.73% 6.38% 0.10% -5.87% -6.19% -7.48% -5.44% 0.10% -2.62% -1.60% -2.20% -1.85% 0.10% -1.50% -3.00% -0.25% -2.17% 0.10% 0.97% -0.01% 1.36% -0.80% 0.34 rf intercept 0.00 4.79 Contrafund rtns 1/31/2000 2/29/2000 4.66% 3/31/2000 4.62% 4/28/2000 -6.47% 5/31/2000 -3.88% 6/30/2000 3.86% 7/31/2000 -2.20% 8/31/2000 5.35% 9/29/2000 -1.80% 10/31/2000 -2.50% 11/30/2000 -7.36% 12/29/2000 3.33% 1/31/2001 -3.94% 2/28/2001 -4.66% 3/30/2001 -5.08% 4/30/2001 4.73% 5/31/2001 1.38% 6/29/2001 -2.52% 7/31/2001 -0.60% 8/31/2001 -3.00% 9/28/2001 -5.57% 10/31/2001 0.87% 11/30/2001 3.46% 12/31/2001 2.30% 1/31/2002 -0.61% 2/28/2002 0.21% 3/29/2002 3.29% 4/30/2002 0.00% 5/31/2002 0.40% 6/28/2002 -4.16% 7/31/2002 -6.82% 8/30/2002 0.89% 9/30/2002 -3.96% 10/31/2002 2.29% 11/29/2002 -0.45% 12/31/2002 -0.67% 1/31/2003 -3.17% 2/28/2003 -1.17% small cap rf 0.606 1.947 #N/A #N/A #N/A 0.31 intercept -0.001 0.003 #N/A #N/A #N/A -0.16 Date Adj CIWM Adj CI IWF Adj CIWD 12/1/00 36.701202 51.067047 37.732224 1/1/01 38.851887 54.911652 37.873379 2/1/01 36.252785 45.164543 36.851631 3/1/01 34.500801 40.176193 35.382107 4/1/01 37.425968 45.406521 37.289108 5/1/01 38.236225 44.820114 38.111423 6/1/01 39.31657 44.217865 37.080372 7/1/01 37.231766 42.62434 37.263126 8/1/01 36.326416 39.136379 35.72794 9/1/01 31.029694 35.275848 33.019157 10/1/01 32.925529 37.083244 32.77177 11/1/01 35.570793 40.59568 34.792259 12/1/01 37.41534 40.452755 35.3344 1/1/02 37.465752 39.724609 35.278843 2/1/02 36.297382 38.285408 35.458214 3/1/02 38.984631 39.494011 37.008514 4/1/02 39.498089 36.246662 35.759525 5/1/02 37.626503 35.29932 35.772388 6/1/02 35.345531 32.003437 33.554699 7/1/02 30.708925 30.365191 30.750504 8/1/02 30.513443 30.333284 30.860247 9/1/02 27.972284 27.327862 27.322302 10/1/02 29.222752 29.684408 29.594444 11/1/02 31.697851 31.385458 31.483463 12/1/02 29.736582 29.037535 29.769724 1/1/03 29.261566 28.398165 29.218679 2/1/03 28.38261 28.326092 28.584913 month OAKIX rtn rf 1/1/01 2/1/01 -2.61% 3/1/01 -7.90% 4/1/01 7.73% 5/1/01 3.36% 6/1/01 -1.21% 7/1/01 -2.90% 8/1/01 -1.33% 9/1/01 -14.86% 10/1/01 2.84% 11/1/01 6.76% 12/1/01 5.53% 1/1/02 -0.83% 2/1/02 2.64% 3/1/02 9.49% 4/1/02 1.36% 5/1/02 1.10% 6/1/02 -4.59% 7/1/02 -11.34% 8/1/02 -1.29% 9/1/02 -11.94% 10/1/02 3.78% 11/1/02 5.23% 12/1/02 -0.16% 1/1/03 -3.42% 2/1/03 -6.30% 3/1/03 -2.44% SP500 R2000 R1000G R1000V lg growth lg value 0.43% -9.12% -6.69% -17.75% -2.70% style regression 0.41% -6.34% -4.83% - 11.04% -3.99% R 1000V R 1000G R2000 SP500 0.37% 7.77% 8.48% 13.02% 5.39% coeff 1.362 0.547 0.150 -0.998 0.32% 0.67% 2.16% -1.29% 2.21% std err 0.308 0.263 0.103 0.510 0.30% -2.43% 2.83% -1.34% -2.71% R2, ser 0.6412 0.0372 #N/A #N/A 0.29% -0.98% -5.30% -3.60% 0.49% F, dof 82.5731 231 #N/A #N/A 0.29% -6.26% -2.43% -8.18% -4.12% ssres, ssreg 0.5703 0.3191 #N/A #N/A 0.28% -8.08% -14.58% -9.86% -7.58% tstats 4.42 2.08 1.45 -1.96 0.22% 1.91% 6.11% 5.12% -0.75% 0.18% 7.67% 8.03% 9.47% 6.17% very positive loading on large value 0.16% 0.88% 5.19% -0.35% 1.56% smaller loading on large growth 0.14% -1.46% 0.13% -1.80% -0.16% negative loading on SP500 (large cap) 0.14% -1.93% -3.12% -3.62% 0.51% insignificant loadings on small cap & tbills 0.14% 3.76% 7.40% 3.16% 4.37% insignificant (& slightly negative) alpha 0.15% -6.06% 1.32% -8.22% -3.37% Rsq = 0.64 0.14% -0.74% -4.74% -2.61% 0.04% 0.14% -7.12% -6.06% -9.34% -6.20% coeffs constrained to be > 0 sum sq res: 0.14% -7.80% -13.12% -5.12% -8.36% R 1000V IR1000G R2000 SP500 0.14% 0.66% -0.64% -0.11% 0.36% 0.82 0.09 0.17 0.00 0.14% -10.87% -8.33% -9.91% -11.46% 0.14% 8.80% 4.47% 8.62% 8.32% 0.13% 5.89% 8.47% 5.73% 6.38% 0.10% -5.87% -6.19% -7.48% -5.44% 0.10% -2.62% -1.60% -2.20% -1.85% 0.10% -1.50% -3.00% -0.25% -2.17% 0.10% 0.97% -0.01% 1.36% -0.80% 0.34 rf intercept 0.00 4.79 Contrafund rtns 1/31/2000 2/29/2000 4.66% 3/31/2000 4.62% 4/28/2000 -6.47% 5/31/2000 -3.88% 6/30/2000 3.86% 7/31/2000 -2.20% 8/31/2000 5.35% 9/29/2000 -1.80% 10/31/2000 -2.50% 11/30/2000 -7.36% 12/29/2000 3.33% 1/31/2001 -3.94% 2/28/2001 -4.66% 3/30/2001 -5.08% 4/30/2001 4.73% 5/31/2001 1.38% 6/29/2001 -2.52% 7/31/2001 -0.60% 8/31/2001 -3.00% 9/28/2001 -5.57% 10/31/2001 0.87% 11/30/2001 3.46% 12/31/2001 2.30% 1/31/2002 -0.61% 2/28/2002 0.21% 3/29/2002 3.29% 4/30/2002 0.00% 5/31/2002 0.40% 6/28/2002 -4.16% 7/31/2002 -6.82% 8/30/2002 0.89% 9/30/2002 -3.96% 10/31/2002 2.29% 11/29/2002 -0.45% 12/31/2002 -0.67% 1/31/2003 -3.17% 2/28/2003 -1.17%
Step by Step Solution
There are 3 Steps involved in it

Get step-by-step solutions from verified subject matter experts