

Question: Using the data provided, including comparable data, explain the assumptions you made for the risk-free rate (Hint: Exhibit 4). How did you use the comparable
Using the data provided, including comparable data, explain the assumptions you made for the risk-free rate (Hint: Exhibit 4). How did you use the comparable firm data (Exhibit 9) in this analysis?
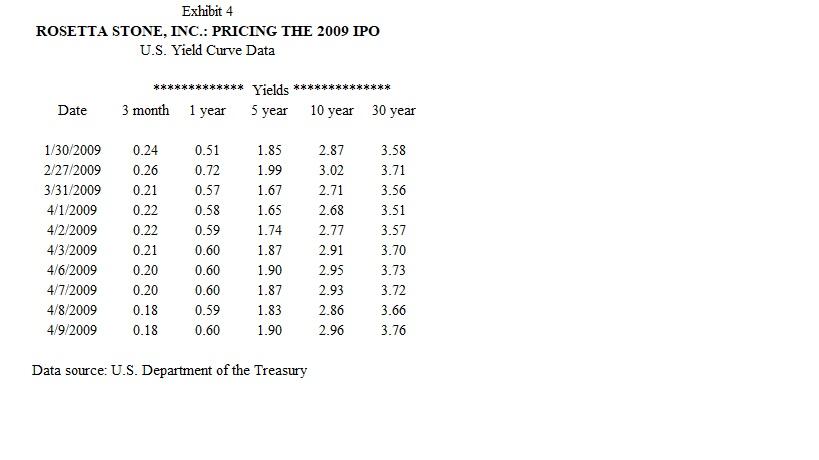
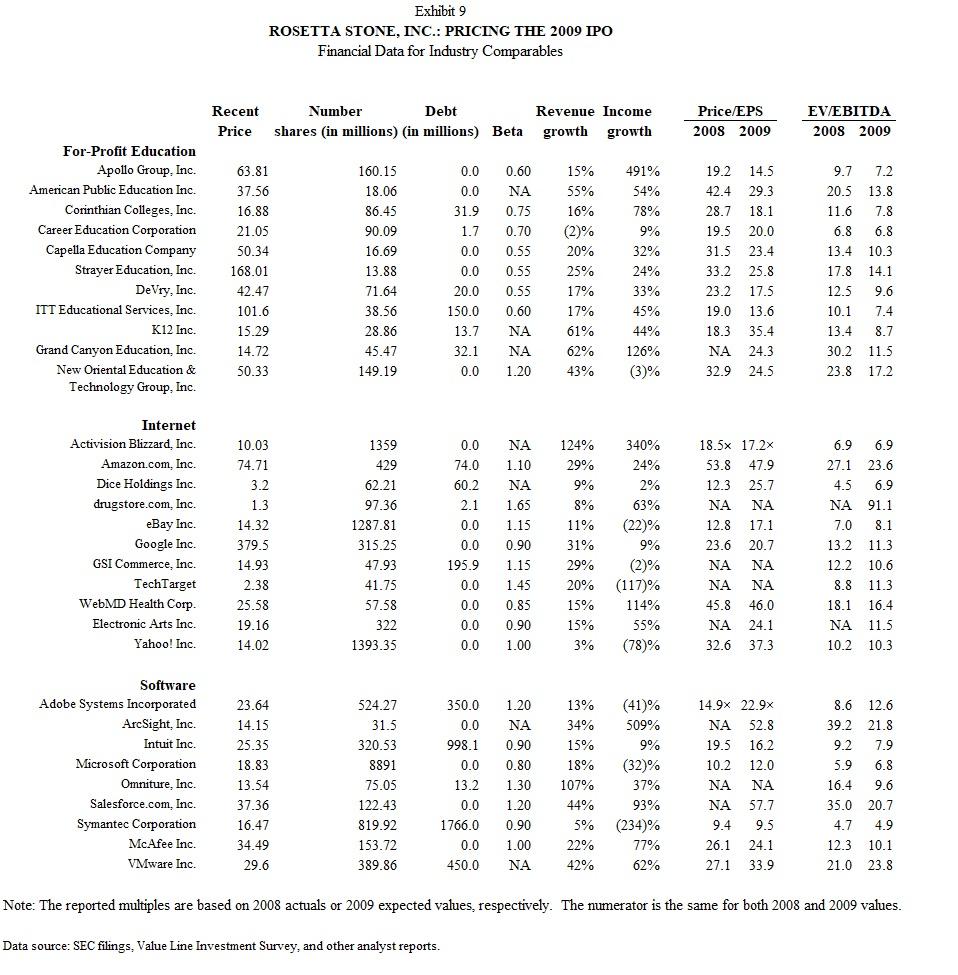
Exhibit 4 ROSETTA STONE, INC.: PRICING THE 2009 IPO U.S. Yield Curve Data Date ********* Yields 5 year 3 month 1 year 0.51 0.72 0.57 0.58 0.59 0.60 0.60 0.60 1/30/2009 0.24 2/27/2009 0.26 3/31/2009 0.21 4/1/2009 0.22 4/2/2009 0.22 4/3/2009 0.21 4/6/2009 0.20 4/7/2009 0.20 4/8/2009 0.18 0.59 4/9/2009 0.18 0.60 1.85 1.99 1.67 1.65 1.74 1.87 1.90 1.87 1.83 1.90 ***** Data source: U.S. Department of the Treasury 10 year 30 year 2.87 3.02 2.71 2.68 2.77 2.91 2.95 2.93 2.86 2.96 3.58 3.71 3.56 3.51 3.57 3.70 3.73 3.72 3.66 3.76 For-Profit Education Apollo Group, Inc. American Public Education Inc. Corinthian Colleges, Inc. Career Education Corporation Capella Education Company Strayer Education, Inc. DeVry, Inc. ITT Educational Services, Inc. K12 Inc. Grand Canyon Education, Inc. New Oriental Education & Technology Group, Inc. Internet Activision Blizzard, Inc. Amazon.com, Inc. Dice Holdings Inc. drugstore.com, Inc. eBay Inc. Google Inc. GSI Commerce, Inc. TechTarget WebMD Health Corp. Electronic Arts Inc. Yahoo! Inc. Software Adobe Systems Incorporated ArcSight, Inc. Intuit Inc. Microsoft Corporation Omniture, Inc. Salesforce.com, Inc. Symantec Corporation McAfee Inc. VMware Inc. Exhibit 9 ROSETTA STONE, INC.: PRICING THE 2009 IPO Financial Data for Industry Comparables Recent Number Debt Price shares (in millions) (in millions) Beta 63.81 37.56 16.88 21.05 50.34 168.01 42.47 101.6 15.29 14.72 50.33 10.03 74.71 3.2 1.3 14.32 379.5 14.93 2.38 25.58 19.16 14.02 23.64 14.15 25.35 18.83 13.54 37.36 16.47 34.49 29.6 160.15 18.06 86.45 90.09 16.69 13.88 71.64 38.56 28.86 45.47 149.19 1359 429 62.21 97.36 1287.81 315.25 47.93 41.75 57.58 322 1393.35 524.27 31.5 320.53 8891 75.05 122.43 819.92 153.72 389.86 0.0 0.0 31.9 1.7 0.70 0.0 0.55 0.0 0.55 20.0 0.55 150.0 0.60 13.7 1.20 32.1 BE 0.0 0.60 0.75 0.0 74.0 1.10 60.2 2.1 1.65 0.0 1.15 0.0 0.90 195.9 1.15 0.0 1.45 0.0 0.85 0.0 0.90 0.0 1.00 350.0 0.0 998.1 0.0 13.2 0.0 1766.0 Revenue Income growth growth 15% 55% 16% (2)% 20% 25% 17% 17% 61% 62% 43% 124% 29% 9% 8% 11% 491% 54% 78% 9% 32% 24% 33% 1.20 0.90 0.80 1.30 107% 1.20 44% 0.90 5% 0.0 1.00 22% 450.0 42% 45% 44% 126% (3)% 340% 24% 2% 63% (22)% 9% 31% 29% (2)% 20% (117)% 15% 114% 15% 55% 3% (78)% 13% (41)% 34% 509% 15% 9% 18% (32)% 37% 93% (234)% 77% 62% Price/EPS 2008 2009 19.2 14.5 42.4 29.3 28.7 18.1 19.5 20.0 31.5 23.4 33.2 25.8 23.2 17.5 19.0 13.6 18.3 35.4 NA 24.3 32.9 24.5 18.5x 17.2x 53.8 47.9 12.3 25.7 12.8 17.1 23.6 20.7 45.8 46.0 24.1 32.6 37.3 14.9x 22.9x 52.8 19.5 16.2 10.2 12.0 57.7 9.5 26.1 24.1 9.4 27.1 33.9 EV/EBITDA 2008 2009 9.7 7.2 20.5 13.8 11.6 7.8 6.8 6.8 13.4 10.3 17.8 14.1 12.5 9.6 10.1 7.4 13.4 8.7 30.2 11.5. 23.8 17.2 6.9 6.9 27.1 23.6 4.5 6.9 91.1 7.0 8.1 13.2 11.3 12.2 10.6 8.8 11.3 18.1 16.4 NA 11.5 10.3 10.2 8.6 12.6 39.2 21.8 9.2 7.9 5.9 6.8 16.4 9.6 35.0 20.7 4.7 4.9 12.3 10.1 21.0 23.8 Note: The reported multiples are based on 2008 actuals or 2009 expected values, respectively. The numerator is the same for both 2008 and 2009 values. Data source: SEC filings, Value Line Investment Survey, and other analyst reports. Exhibit 4 ROSETTA STONE, INC.: PRICING THE 2009 IPO U.S. Yield Curve Data Date ********* Yields 5 year 3 month 1 year 0.51 0.72 0.57 0.58 0.59 0.60 0.60 0.60 1/30/2009 0.24 2/27/2009 0.26 3/31/2009 0.21 4/1/2009 0.22 4/2/2009 0.22 4/3/2009 0.21 4/6/2009 0.20 4/7/2009 0.20 4/8/2009 0.18 0.59 4/9/2009 0.18 0.60 1.85 1.99 1.67 1.65 1.74 1.87 1.90 1.87 1.83 1.90 ***** Data source: U.S. Department of the Treasury 10 year 30 year 2.87 3.02 2.71 2.68 2.77 2.91 2.95 2.93 2.86 2.96 3.58 3.71 3.56 3.51 3.57 3.70 3.73 3.72 3.66 3.76 For-Profit Education Apollo Group, Inc. American Public Education Inc. Corinthian Colleges, Inc. Career Education Corporation Capella Education Company Strayer Education, Inc. DeVry, Inc. ITT Educational Services, Inc. K12 Inc. Grand Canyon Education, Inc. New Oriental Education & Technology Group, Inc. Internet Activision Blizzard, Inc. Amazon.com, Inc. Dice Holdings Inc. drugstore.com, Inc. eBay Inc. Google Inc. GSI Commerce, Inc. TechTarget WebMD Health Corp. Electronic Arts Inc. Yahoo! Inc. Software Adobe Systems Incorporated ArcSight, Inc. Intuit Inc. Microsoft Corporation Omniture, Inc. Salesforce.com, Inc. Symantec Corporation McAfee Inc. VMware Inc. Exhibit 9 ROSETTA STONE, INC.: PRICING THE 2009 IPO Financial Data for Industry Comparables Recent Number Debt Price shares (in millions) (in millions) Beta 63.81 37.56 16.88 21.05 50.34 168.01 42.47 101.6 15.29 14.72 50.33 10.03 74.71 3.2 1.3 14.32 379.5 14.93 2.38 25.58 19.16 14.02 23.64 14.15 25.35 18.83 13.54 37.36 16.47 34.49 29.6 160.15 18.06 86.45 90.09 16.69 13.88 71.64 38.56 28.86 45.47 149.19 1359 429 62.21 97.36 1287.81 315.25 47.93 41.75 57.58 322 1393.35 524.27 31.5 320.53 8891 75.05 122.43 819.92 153.72 389.86 0.0 0.0 31.9 1.7 0.70 0.0 0.55 0.0 0.55 20.0 0.55 150.0 0.60 13.7 1.20 32.1 BE 0.0 0.60 0.75 0.0 74.0 1.10 60.2 2.1 1.65 0.0 1.15 0.0 0.90 195.9 1.15 0.0 1.45 0.0 0.85 0.0 0.90 0.0 1.00 350.0 0.0 998.1 0.0 13.2 0.0 1766.0 Revenue Income growth growth 15% 55% 16% (2)% 20% 25% 17% 17% 61% 62% 43% 124% 29% 9% 8% 11% 491% 54% 78% 9% 32% 24% 33% 1.20 0.90 0.80 1.30 107% 1.20 44% 0.90 5% 0.0 1.00 22% 450.0 42% 45% 44% 126% (3)% 340% 24% 2% 63% (22)% 9% 31% 29% (2)% 20% (117)% 15% 114% 15% 55% 3% (78)% 13% (41)% 34% 509% 15% 9% 18% (32)% 37% 93% (234)% 77% 62% Price/EPS 2008 2009 19.2 14.5 42.4 29.3 28.7 18.1 19.5 20.0 31.5 23.4 33.2 25.8 23.2 17.5 19.0 13.6 18.3 35.4 NA 24.3 32.9 24.5 18.5x 17.2x 53.8 47.9 12.3 25.7 12.8 17.1 23.6 20.7 45.8 46.0 24.1 32.6 37.3 14.9x 22.9x 52.8 19.5 16.2 10.2 12.0 57.7 9.5 26.1 24.1 9.4 27.1 33.9 EV/EBITDA 2008 2009 9.7 7.2 20.5 13.8 11.6 7.8 6.8 6.8 13.4 10.3 17.8 14.1 12.5 9.6 10.1 7.4 13.4 8.7 30.2 11.5. 23.8 17.2 6.9 6.9 27.1 23.6 4.5 6.9 91.1 7.0 8.1 13.2 11.3 12.2 10.6 8.8 11.3 18.1 16.4 NA 11.5 10.3 10.2 8.6 12.6 39.2 21.8 9.2 7.9 5.9 6.8 16.4 9.6 35.0 20.7 4.7 4.9 12.3 10.1 21.0 23.8 Note: The reported multiples are based on 2008 actuals or 2009 expected values, respectively. The numerator is the same for both 2008 and 2009 values. Data source: SEC filings, Value Line Investment Survey, and other analyst reports
Step by Step Solution
There are 3 Steps involved in it

Get step-by-step solutions from verified subject matter experts