

Question: Using the data set you collected in Week 1, excluding the super car outlier, you should have calculated the mean and standard deviation during Week

Using the data set you collected in Week 1, excluding the super car outlier, you should have calculated the mean and standard deviation during Week 2 for price data. Along with finding a p and q from Week 3. Using this information, calculate two 95% confidence intervals. For the first interval you need to calculate a T-confidence interval for the sample population. You have the mean, standard deviation and the sample size, all you have left to find is the T-critical value and you can calculate the interval. For the second interval calculate a proportion confidence interval using the proportion of the number of cars that fall below the average. You have the p, q, and n, all that is left is calculating a Z-critical value,
Make sure you include these values in your post, so your fellow classmates can use them to calculate their own confidence intervals. Once you calculate the confidence intervals you will need to interpret your interval and explain what this means in words.
Do the confidence intervals surprise you, knowing what you have learned about confidence intervals, proportions and normal distribution? Please the Week 5 Confidence T-Interval Mean and Unknown SD PDF and the Week 5 Confidence Interval Proportions PDF at the bottom of the discussion. This will give you a step by step example on how to help you calculate this using Excel. These PDFs will also help you in Quizzes section.
Once you have posted your initial discussion, you must reply to at least two other learner's post. Each post must be a different topic. So, you will have your initial post from one topic, your first follow-up post from a different topic, and your second follow-up post from one of the other topics. Of course, you are more than welcome to respond to more than two learners."
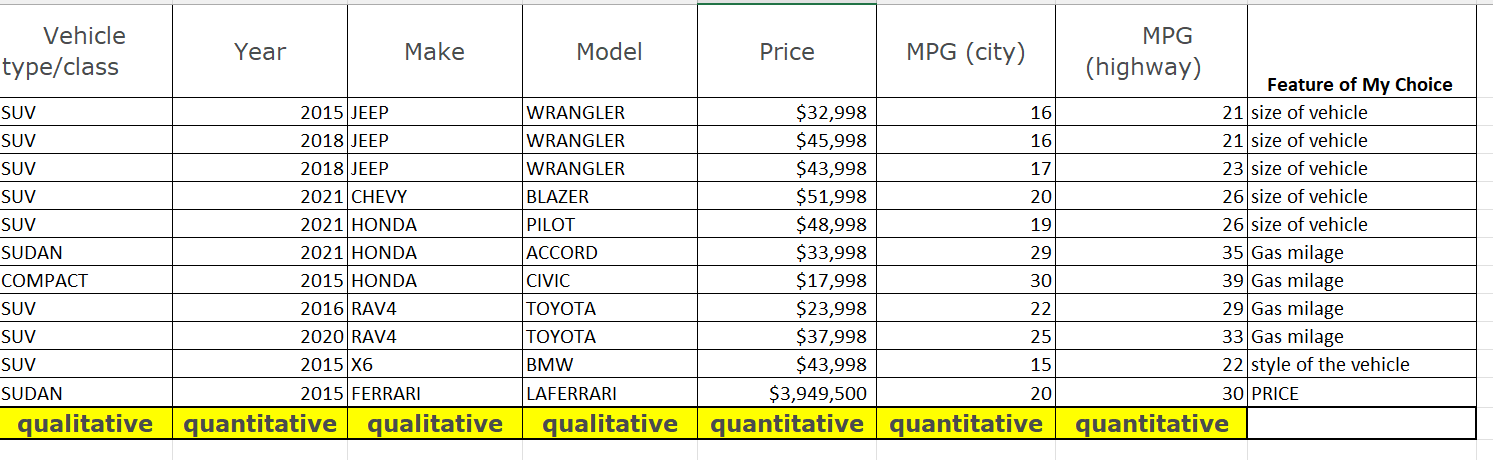
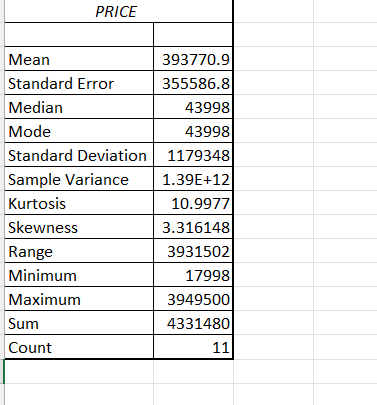
Vehicle MPG Year Make Model Price type/class MPG (city) (highway) Feature of My Choice SUV 2015 JEEP WRANGLER $32,998 16 21 size of vehicle SUV 2018 JEEP WRANGLER $45,998 16 21 size of vehicle SUV 2018 JEEP WRANGLER $43,998 17 23 size of vehicle SUV 2021 CHEVY BLAZER $51,998 20 26 size of vehicle SUV 2021 HONDA PILOT $48,998 19 26 size of vehicle SUDAN 2021 HONDA ACCORD $33,998 29 35 Gas milage COMPACT 2015 HONDA CIVIC $17,998 30 39 Gas milage SUV 2016 RAV4 TOYOTA $23,998 22 29 Gas milage SUV 2020 RAV4 TOYOTA $37,998 25 33 Gas milage SUV 2015 X6 BMW $43,998 15 22 style of the vehicle SUDAN 2015 FERRARI LAFERRARI $3,949,500 20 30 PRICE qualitative quantitative qualitative qualitative quantitative quantitative quantitativePRICE Mean 393770.9 Standard Error 355586.8 Median 43998 Mode 43998 Standard Deviation 1179348 Sample Variance 1.39E+12 Kurtosis 10.9977 Skewness 3.316148 Range 3931502 Minimum 17998 Maximum 3949500 Sum 4331480 Count 11
Step by Step Solution
There are 3 Steps involved in it

Get step-by-step solutions from verified subject matter experts