

Question: Using the data shown in the accompanying contingency table, test whether the population proportions differ at the alphaequals0.05 level of significance by determining (a) the
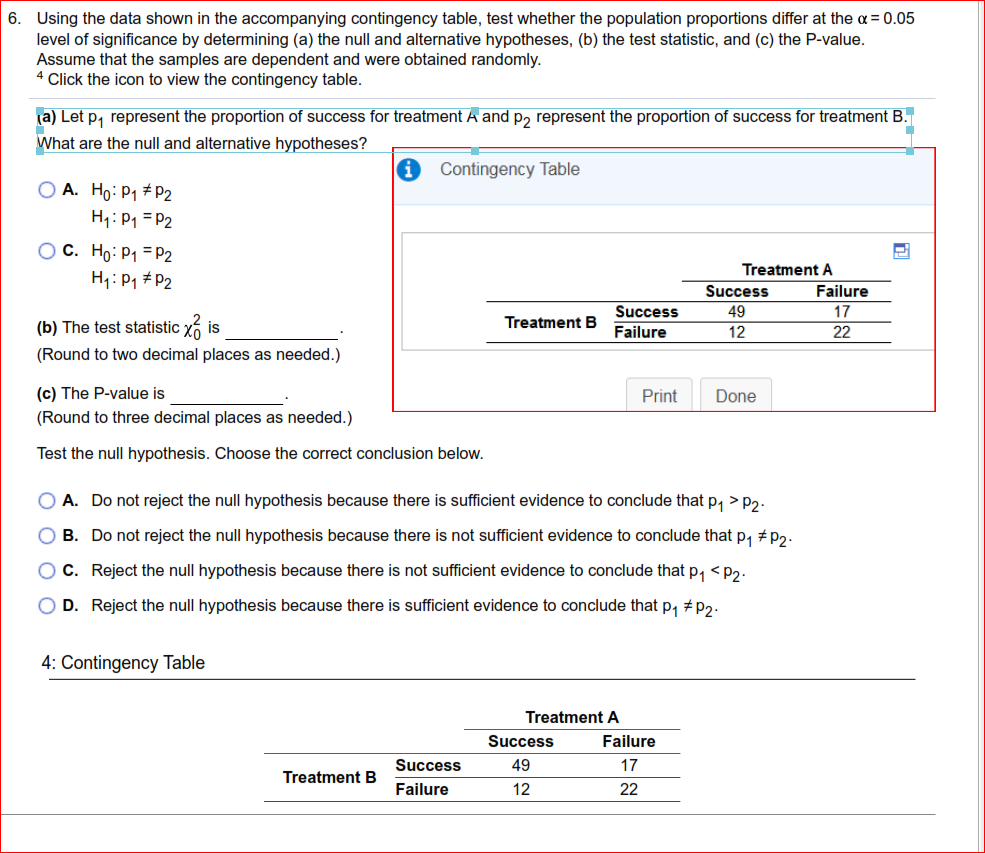
Using the data shown in the accompanying contingency table, test whether the population proportions differ at the alphaequals0.05 level of significance by determining (a) the null and alternative hypotheses, (b) the test statistic, and (c) the P-value. Assume that the samples are dependent and were obtained randomly.
LOADING...
Click the icon to view the contingency table.
\f
Step by Step Solution
There are 3 Steps involved in it
1 Expert Approved Answer
Step: 1 Unlock

Question Has Been Solved by an Expert!
Get step-by-step solutions from verified subject matter experts
Step: 2 Unlock
Step: 3 Unlock