

Question: Using the data values that Cynthia collected, select the correct slope and y-intercept Introduction to Statistics - CHALI X + : https://capella.sophia.org/spcc/introduction-to-statistics-2-challenge-4-3/2/7566/linear- UNIT 4 -
Using the data values that Cynthia collected, select the correct slope and y-intercept
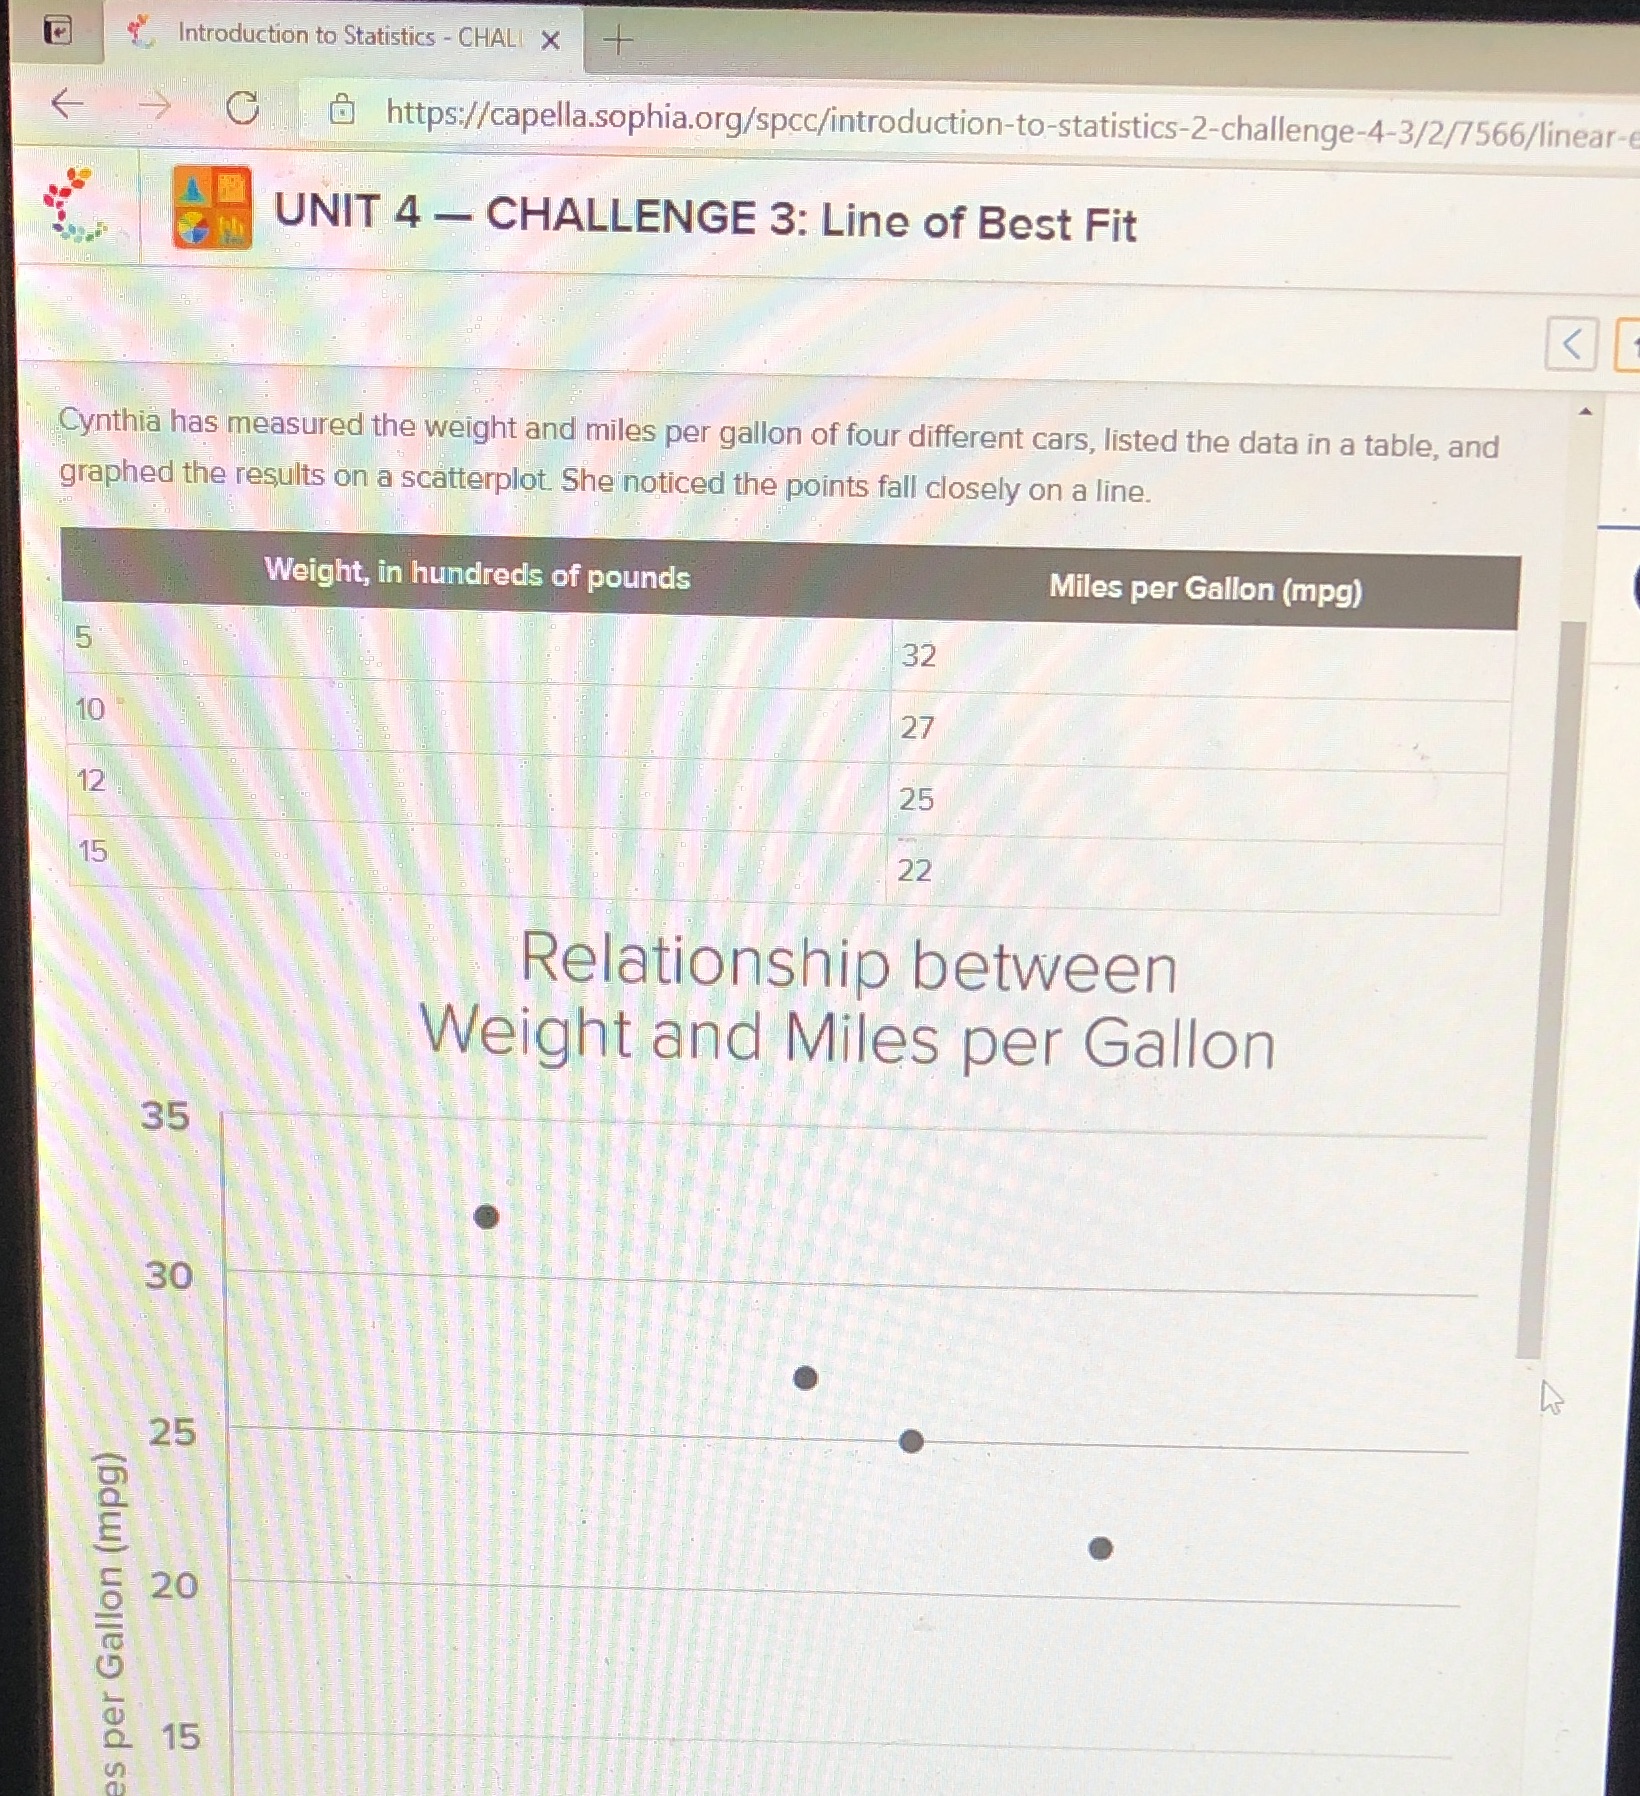
Introduction to Statistics - CHALI X + : https://capella.sophia.org/spcc/introduction-to-statistics-2-challenge-4-3/2/7566/linear- UNIT 4 - CHALLENGE 3: Line of Best Fit Cynthia has measured the weight and miles per gallon of four different cars, listed the data in a table, and graphed the results on a scatterplot. She noticed the points fall closely on a line. Weight, in hundreds of pounds Miles per Gallon (mpg) 32 10 27 12 25 15 22 Relationship between Weight and Miles per Gallon 35 30 25 20 s per Gallon (mpg) 15
Step by Step Solution
There are 3 Steps involved in it
1 Expert Approved Answer
Step: 1 Unlock

Question Has Been Solved by an Expert!
Get step-by-step solutions from verified subject matter experts
Step: 2 Unlock
Step: 3 Unlock