

Question: Using the data you collected in the lab, complete the following chart of mechanical properties. Show all work, but also summarize all results in a
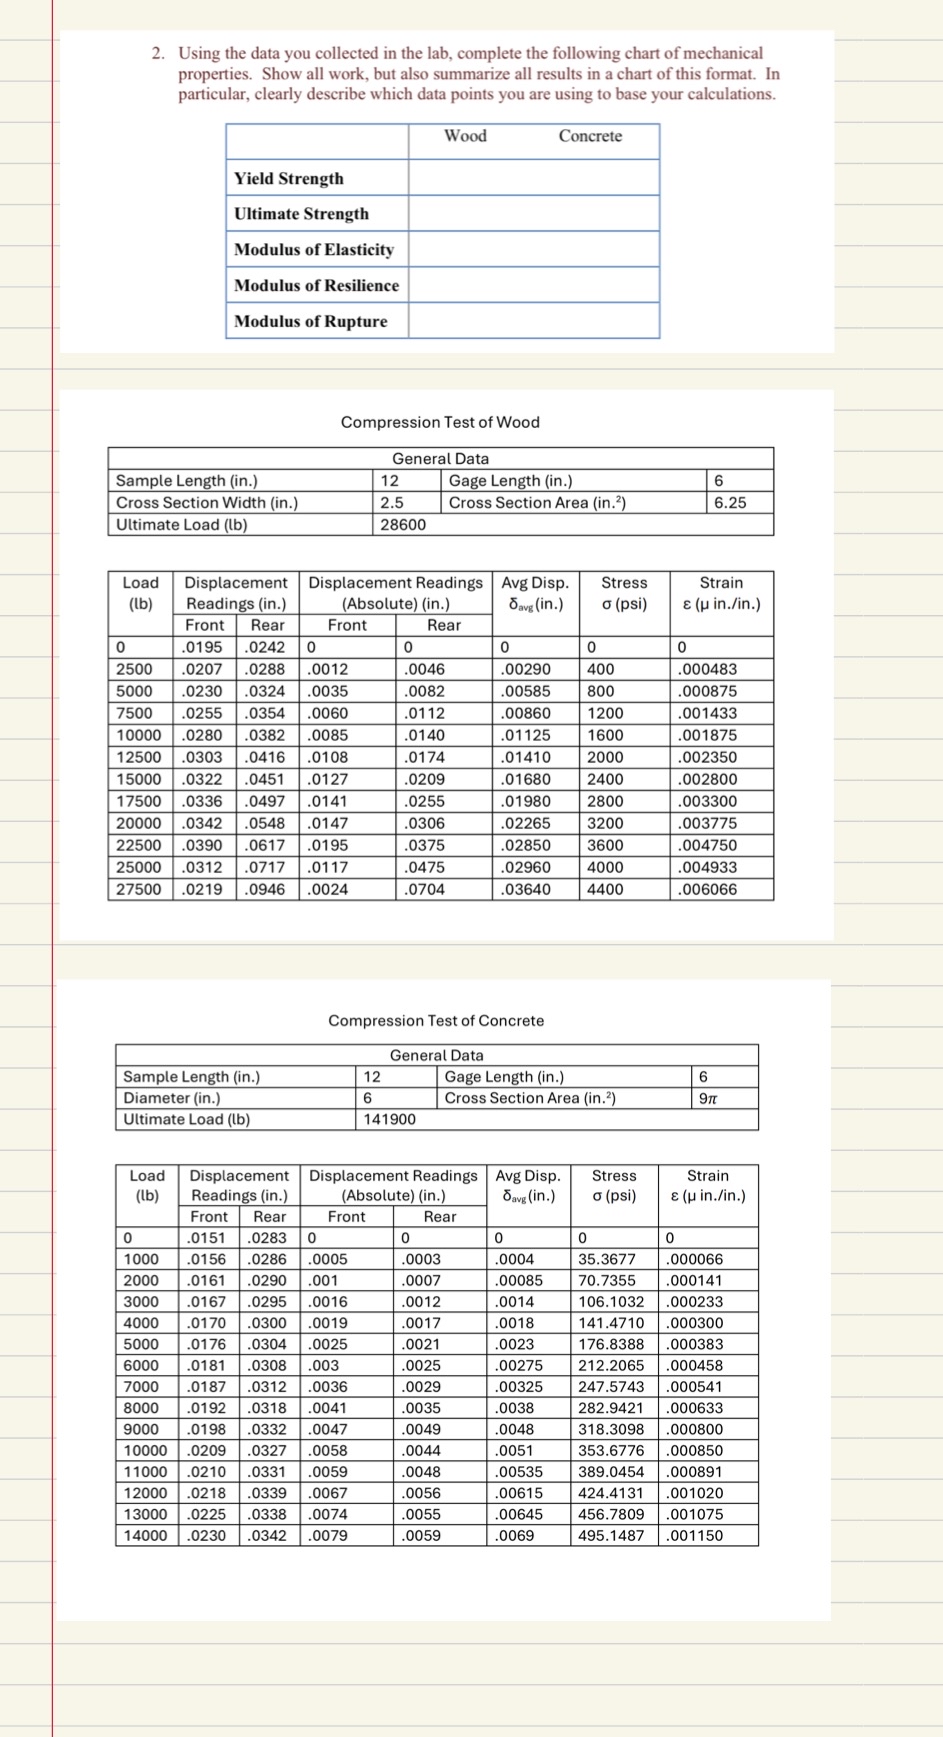
Using the data you collected in the lab, complete the following chart of mechanical properties. Show all work, but also summarize all results in a chart of this format. In particular, clearly describe which data points you are using to base your calculations.
tableWoodYield Strength,Ultimate Strength,Modulus of Elasticity,Modulus of Resilience,Modulus of Rupture,
Compression Test of Wood
tableGeneral DataSample Length inGage Length inCross Section Width inCross Section Area inUltimate Load b
tabletableLoadlbtableDisplacementReadings intableDisplacement ReadingsAbsoluteintableAvg Disp.intableStress
Step by Step Solution
There are 3 Steps involved in it
1 Expert Approved Answer
Step: 1 Unlock

Question Has Been Solved by an Expert!
Get step-by-step solutions from verified subject matter experts
Step: 2 Unlock
Step: 3 Unlock