

Question: Using the diagram below. Answer the following question. In this figure there are two clusters. They are connected by a line which represents the distance
Using the diagram below. Answer the following question.
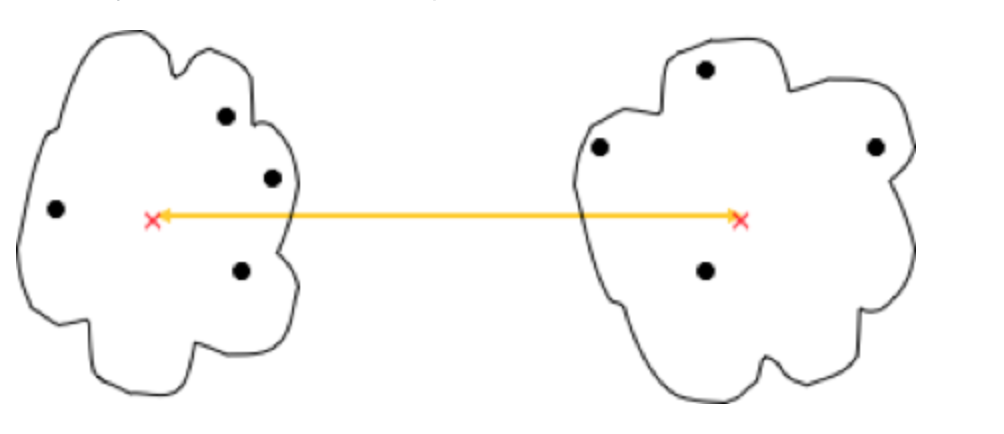
In this figure there are two clusters. They are connected by a line which represents the distance used to determine inter-cluster similarity. Which inter-cluster similarity metric does this line represent? Choose one of the following options and explain your answer.
A. Min
B. Group Average
C. Max
D. Distance Between Centroids
E. Ward's Method
Step by Step Solution
There are 3 Steps involved in it
1 Expert Approved Answer
Step: 1 Unlock

Question Has Been Solved by an Expert!
Get step-by-step solutions from verified subject matter experts
Step: 2 Unlock
Step: 3 Unlock