

Question: Using the diamonds data frame, recreate the R code necessary to generate the following graphs. In your submission, show both the R code and the
Using the diamonds data frame, recreate the R code necessary to generate the following graphs. In your submission, show both the R code and the graphs. Which diamond color is best, and which color is worst? (Hint: type help(diamonds) to read the documentation for this data set)
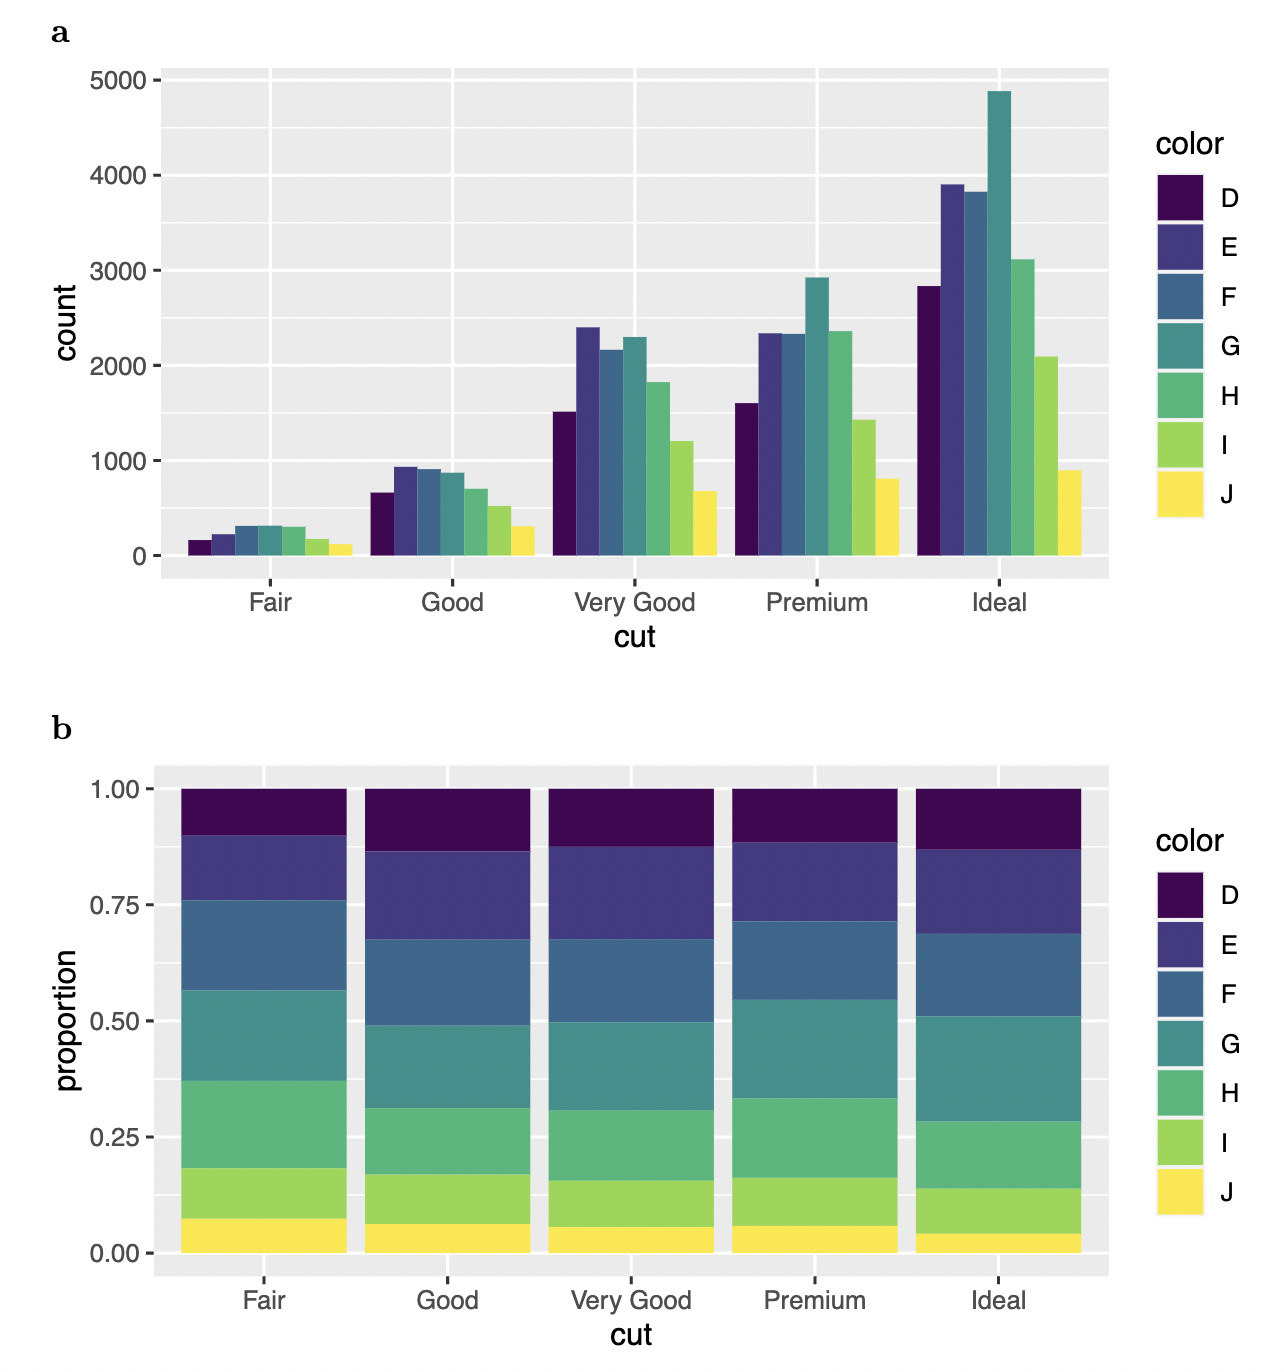
a 5000 - color 4000 - D m 3000 - TI count G 2000 - H 1000 - C 0 - Fair Good Very Good Premium Ideal cut b 1.00 - color 0.75 - proportion T D m F 0.50 - H 0.25 - C 0.00 - Fair Good Very Good Premium Ideal cut
Step by Step Solution
There are 3 Steps involved in it
1 Expert Approved Answer
Step: 1 Unlock

Question Has Been Solved by an Expert!
Get step-by-step solutions from verified subject matter experts
Step: 2 Unlock
Step: 3 Unlock