

Question: Using the EOQ solver Excel Data analysis tool and the following data provide a brief narrative on your EOQ analyses. How would adding additional reorder
Using the EOQ solver Excel Data analysis tool and the following data provide a brief narrative on your EOQ analyses. How would adding additional reorder points change the annual cost? What implications does this have for the business?
- Annual demand = 200000
- Ordering cost = 45
- Annual Inventory holding rate = 25
- Cost per unit = 10
- Working days per year = 365
- Lead-time = 7 days
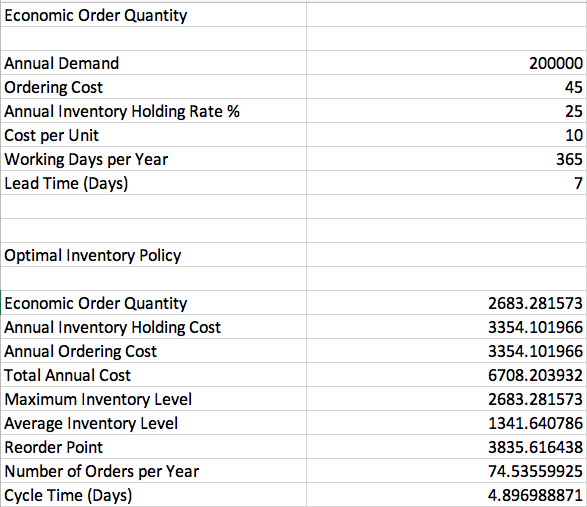
Economic Order Quantity Annual Demand Ordering Cost Annual Inventory Holding Rate % Cost per Unit Working Days per Year Lead Time (Days) 200000 45 25 10 365 7 Optimal Inventory Policy Economic Order Quantity Annual Inventory Holding Cost Annual Ordering Cost Total Annual Cost Maximum Inventory Level Average Inventory Level Reorder Point Number of Orders per Year Cycle Time (Days) 2683.281573 3354.101966 3354.101966 6708.203932 2683.281573 1341.640786 3835.616438 74.53559925 4.896988871 Economic Order Quantity Annual Demand Ordering Cost Annual Inventory Holding Rate % Cost per Unit Working Days per Year Lead Time (Days) 200000 45 25 10 365 7 Optimal Inventory Policy Economic Order Quantity Annual Inventory Holding Cost Annual Ordering Cost Total Annual Cost Maximum Inventory Level Average Inventory Level Reorder Point Number of Orders per Year Cycle Time (Days) 2683.281573 3354.101966 3354.101966 6708.203932 2683.281573 1341.640786 3835.616438 74.53559925 4.896988871
Step by Step Solution
There are 3 Steps involved in it

Get step-by-step solutions from verified subject matter experts