

Question: Using the essential elements : Mean, median, mode and standard deviation. Please indicate the most popular tour for business travelers in Objective 35 Part 5
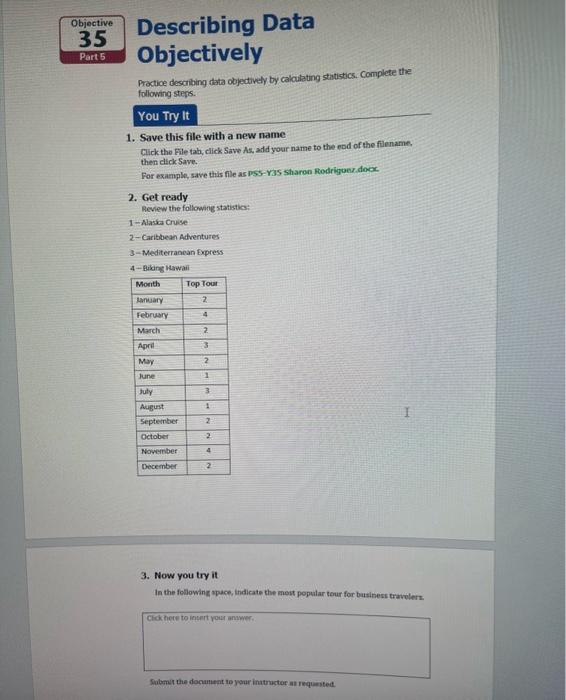
Describing Data 0bjectively Most people can visualize images, concepts, and trends more easily than large sets of numbers. When presenting data to support a decision, provide your audience with an objective description of that data. You can use statistics to explain and compare the characteristics of your data. Table 5-1 lists the do's and don'ts for describing data objectively. designed for business travelers. She asks you to calculate some basic statistics about the prices. 1. Mean The arithmetic mean value of a set of data is usually referted to as the average. The mean is the most common descriptive statistic and is simple to compute. Sum the values in your data and divide by the number of items that you counted. The mean is a single value and describes the data in general by showing its central tendency. See Figure \$-6. 2. Median The median value of a set of data is that point that separates the higher values from the lower values. The median is similar to the mean, but is less susceptible to distortion by extremely latge or small values. The median is calculated by ordering all of your data from lowest value to highest value and selecting the middle one. If you have an even number of data points, use the mean of the two middle values. 3. Mode The mode of a set of data is the value that occurs most frequently. The mode does not have to be a unique number. Some data sets might have more than one mode. Although means are affected by extremely largeor small values in the data set, modes ate not. This makes modes useful for describing data that includes widely varying numbers. The mode itself can also reveal useful patterns. For example, if you are measuring the week of the year (1-52) when people take particular tours, you might find that week 14 is the mode, as in Figure 5-6. This could be useful for planning future marketing campaigns and new tour offerings. 4. Standard deviation Standard deviation is a measure of the variability of a set of data. A low standard deviation indicates that the data points tend to be very close to the mean (minimal variability). A higher standard deviation indicates that the data are spread out over a larger range of values and that they are farther from the mean (greater variability). For example, when planning what to wear on a tour, two destination cities might have the same average temperatures ( 75 degrees). However, the mean alone might not be enough information. One city has daytime highs of 95 degrees and evening lows of 55 . The other varies between 78 and 72 degrees. You would need to instruct your clients to pack differently depending on their destination. The standard deviation provides an insight that the mean or medtan temperatures do not. Practice describing data objectively by calculating statistics. Open the PS5-Y35.docx document and follow the steps in the worksheet. When you are finished, submit the document to your instructor as requested. Proctice describing data objectively by calculating stitistics. Complete the following steps. 1. Save this file with a new mame Click the File tah, click Save As, add your name to the end of the filename. then click Save. For example, save this file as pss-ras sharon Roodrigon docex. 2. Get ready Review the following statistics: 1 - Alaris Cruise 2- Caritbean Adventures 3 - Mediterranean Express 4 - Bikang itswaii 3. Now you try it In the following opace, indicate the mest popular tour for business travelers. Click here to intert your anwer. Submit the donmient to your inatructor at requented
Step by Step Solution
There are 3 Steps involved in it

Get step-by-step solutions from verified subject matter experts