Question: Using the Excel file below, compute the financial ratios for the hospital industry and analyze Northside Hospital's data Income Statement for Hospital Industry 2015 2016
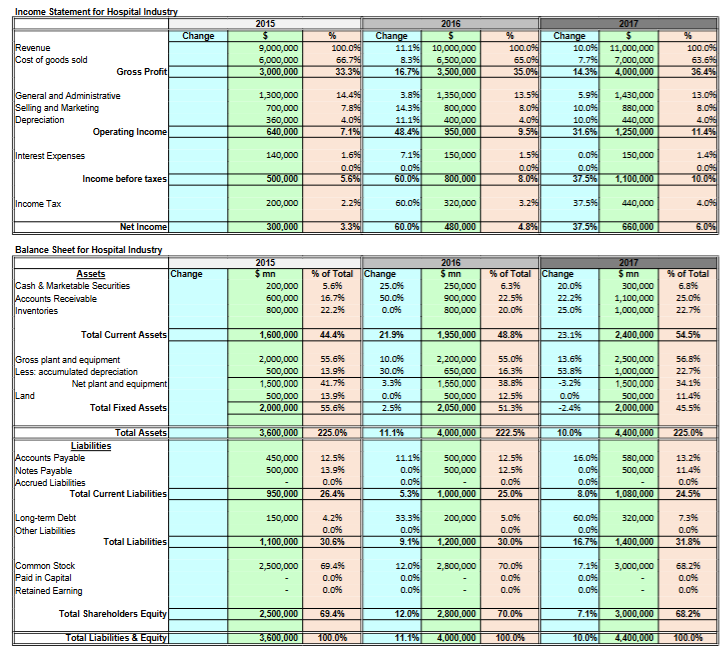
Using the Excel file below, compute the financial ratios for the hospital industry and analyze Northside Hospital's data
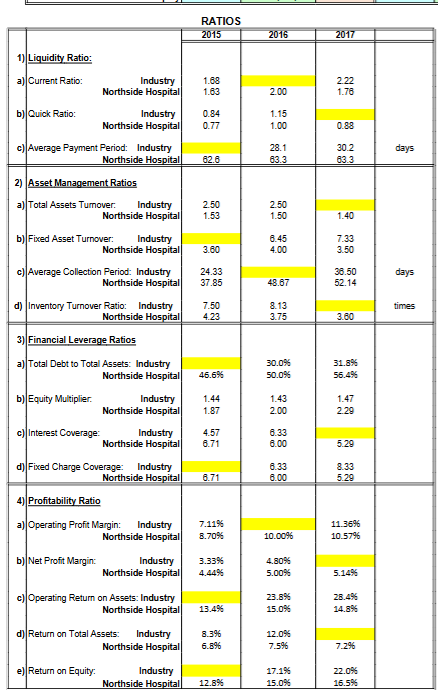
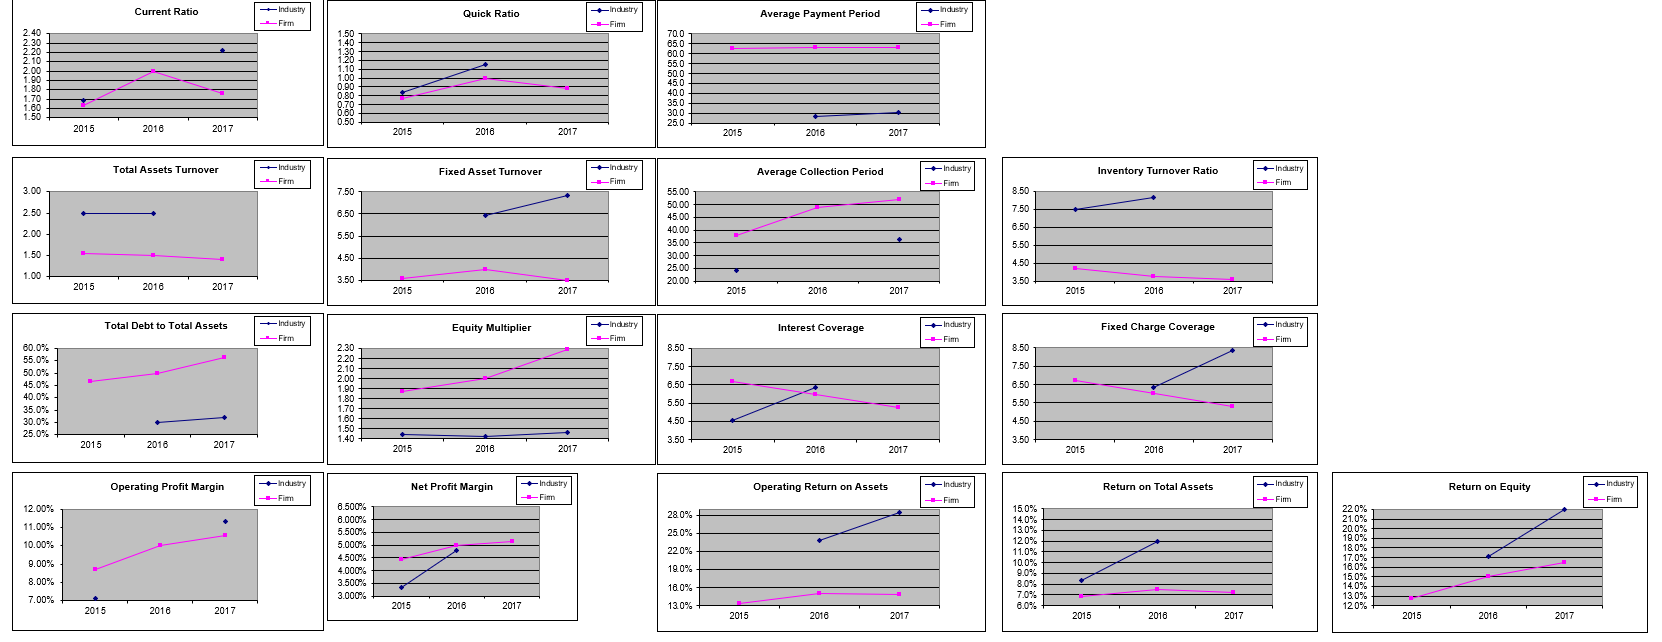
Income Statement for Hospital Industry 2015 2016 2017 Change $ % Change Change Revenue 9,000,000 100109% 11.19% 10,000,000 100 0% 10.09% 11,000,000 100 096 |Cost of goods sold 5,000,000 56.79% 8.39% 6 500,000 65.090 7.79% 7,000,000 63.696 Gross Profit 3,000,000 33.39% 16.7% 3,500,000 35.0% 14.3% 4,000,000 36 494 General and Administrative 1,300,000 14.49% 3.89% 1,350,000 5.996 1,430,000 13.096 Selling and Marketing 700,000 7.89% 14.39% 800,000 10.09% 830,000 8.096 Depreciation 360,000 4.0% 11.1% 400,000 101019 440,000 4.096 Operating Income 640,000 7.1% 48.4% 950,000 31.6% 1,250,000 114% Interest Expenses 140,000 1.629 7.19: 150,000 150,000 1.490 0.09% 0.096 Income before taxes 500.000 5.69% 6010% 800 000 37.5%% 1,1001000 Income Tax 200,000 2.298 60.09 320,000 3.294 37.519 440,000 Net Income 300.000 3.3% 6010% 480 000 4.894 37.5%% 6601000 60% Balance Sheet for Hospital Industry 2015 2016 2017 Assets Change imn % of Total Change 5mn % of Total Change imn * of Total Cash & Marketable Securities 200,000 5.696 25.01% 250,000 300,000 6.8% Accounts Receivable 500,000 15.7% 50.09% 900,000 22.5%% 22.2% 1,100,000 25.046 Inventories BOO,000 22.29% 0.036 100,000 201096 25.0% 1,000,000 22.716 Total Current Assets 1,600,000 44.4% 1.9% .950,000 48.8% 23.19 2.400,000 14.5%% Gross plant and equipment 2,000,000 55.69 10.09% 2,200,000 55.016 13.6% 2,500,000 56.816 Less: accumulated depreciation 500,000 13.99 30.09 650,000 16.34 53.895 1,000,000 22.716 Net plant and equipment 1,500,000 41.7% 3.31 .550,000 38.8X 3.29% .500 000 34.196 Land 500,000 13.9% 0.016 500,000 12.5% 500,000 11.4% Total Fixed Assets 2,000,000 55.69% 2.51 2.050,000 51.3X 2.49% 2,000,000 45.516 Total Assets 3,600,000 225.0% 11.1% 4,000,000 222.5% 10.0% 4,400,000 225.0% Liabilities Accounts Payable 450,000 12.59 11.1% 500,000 12.5% 16.09% 580,000 13.216 Notes Payable 500,000 13.9% 0.09% 500,000 12.5%6 0.09% 500,000 11.4%6 Accrued Liabilities 0.09 0.09% 0.09 0.09 0.09 Total Current Liabilities 950,000 26.49% 5.30% 1,000.000 25.09 8.0% 1.080.000 24.5% Long-term Debt 150,000 33.39% 200,000 5.09 320,000 7.39 Other Liabilities 0.09% 0.09 0.09 0.0% Total Liabilities 1.100,000 30.6% 9.1% 1.200,000 30.09% 16.7% 1.400.000 31.8% Common Stock 2,500,000 69.496 12.09% 2 800,000 70.07 3,000,000 68.216 Paid in Capital 0.09% 0.096 0109% 0.09 Retained Earning 0.096 0.09% 010% Total Shareholders Equity 2,500,000 69.44% 12.0% 2,800,000 70.0% 7.1% 3.000,000 58.2% Total Liabilities & Equity 3.600 000 100.0% 11.1% 4,000.000 100.0% 10.0% 4:400 000RATIOS 2015 2016 2017 1) Liquidity Ratio: a) Current Ratio: Industry 1.68 2.22 Northside Hospital 1.63 200 1.78 b] Quick Ratio: Industry 0.84 1.15 Northside Hospital 0.77 1.00 0.89 c] Average Payment Period: Industry 28.1 30.2 days Northside Hospital 82.8 83.3 63.3 2) Asset Management Ratios a] Total Assets Tumover. Industry 2.50 2.50 Northside Hospital 1.53 1.50 1.40 b] Fixed Asset Turnover: Industry 3.45 7.33 Northside Hospital 3.60 4.00 3.50 c) Average Collection Period: Industry 24.33 36.50 days Northside Hospital 37.85 48.67 52.14 d) Inventory Turnover Ratio: Industry 7.50 8.13 times Northside Hospital 4.23 3.75 3.60 3) Financial Leverage Ratios a] Total Debt to Total Assets: Industry 30.0% 31.8% Northside Hospital 45.69 50.0% 56.49% b] Equity Multiplier. Industry 1.44 1.43 1.47 Northside Hospital 1.87 2.00 2.20 c] Interest Coverage: Industry 4.57 6.33 Northside Hospital 8.71 8.00 5.20 dj Fixed Charge Coverage: Industry 6.33 8.33 Northside Hospital 8.71 8.00 5.29 4) Profitability Ratio a] Operating Profit Margin: Industry 7.11% 11.36% Northside Hospital 6.70% 10.0096 10.579% b] Net Profit Margin: Industry 3.33% 4.809% Northside Hospital 4.4496 5.00% 5.149% c) Operating Return on Assets: Industry 23.89% 26.49% Northside Hospital 13.4% 15.0% 14.8% d) Return on Total Assets: Industry 8.3% 12.0% Northside Hospital 7.5%% e) Return on Equity: Industry 17.1% 22.0% Northside Hospital 12.8% 15.09% 16.59Current Ratio -+ Industry --Firm Quick Ratio +Industry +Industry -Firm Average Payment Period -Firm 70.0 65.0 60 0 - PANNNNN 55.0 - 2838886858 38383825868 50.0 - 45.0 40.0 350 30.0 2015 2016 2017 2015 2016 25.0 2017 2015 2018 2017 Total Assets Turnover Industry Fixed Asset Turnover +Industry *Industry 3.00 -Firm Average Collection Period Industry 7.50 -Firm Inventory Turnover Ratio 55.00 -Fim 2.50 8.50 -Firm 8.50 50.00 45.00 7.50 2.00 5.50 40.00 8.50 1.50 35.00 4.50 30.00 5.50 1.00 25.00 4.50 2015 2018 2017 3.50 2015 2018 20.00 2017 2015 3.50 2016 2017 2015 2016 2017 Total Debt to Total Assets + Industry --Firm Equity Multiplier *Industry Firm Interest Coverage *Industry 60.0% - Finn Fixed Charge Coverage +Industry 55.0% 2.30 8.50 8.50 -Firm 50.0% 2.10- 2.00 7.50 45.0% 7.50 40.0% 6.50 6.50 35.0% 1.70 - 5.50 30.0% 1.60 5.50 25.0% 1.50 4.50 4.50 2015 2016 2017 1.40- 2015 3.50 2016 2017 2015 2018 3.50 2017 2015 2016 2017 Operating Profit Margin +Industry +Industry -Firm Net Profit Margin -Fim Operating Return on Assets *Industry 12.00% Return on Total Assets *Industry 8.500% Return on Equity +Industry 3.000% 28 0% 15.0% Firm 11.00% -Fim 220% 5.500% 14.0% 10.00% 21.0% 5.0009 25 0% 130% 20.0% 4.500% 22 0% 12 0% 9.00% 19.0% 11.0% 18.0% 8.00% 4.000% 19.0% 10.0% 17.0% 3.500% Z 16.0% 7.00% 3.000% 18 0% 91072 8.0% 15.0% 2015 2016 14.0% 2018 2017 2015 2017 130% 7.0% 13 0% 2015 8.0% 2018 2017 2015 120% 2016 2017 2015 2018 2017
Step by Step Solution
There are 3 Steps involved in it
1 Expert Approved Answer
Step: 1 Unlock
Question Has Been Solved by an Expert!
Get step-by-step solutions from verified subject matter experts
Step: 2 Unlock
Step: 3 Unlock
Students Have Also Explored These Related Finance Questions!