

Question: **Using the excel spreadsheet, answer the following points regarding finance of Microsoft? *What changes to the inputs would allow your Constant Growth Model to provide
**Using the excel spreadsheet, answer the following points regarding finance of Microsoft?
*What changes to the inputs would allow your Constant Growth Model to provide a value consistent with the current stock price. What change in the dividend growth rate could be used to equate to the current stock price with the discount rate provided? Would a change in the discount rate, higher or lower, influence the valuation? How?
*Explain why the estimated stock price from the CGM should or should not be relied upon given the inputs?
*Compare and contrast regarding analyzing the average target price and recommendations. Is there a clear recommendation?
*Would you invest in this stock? Why or why not?
*Would you characterize your stock as undervalued or overvalued? Explain.
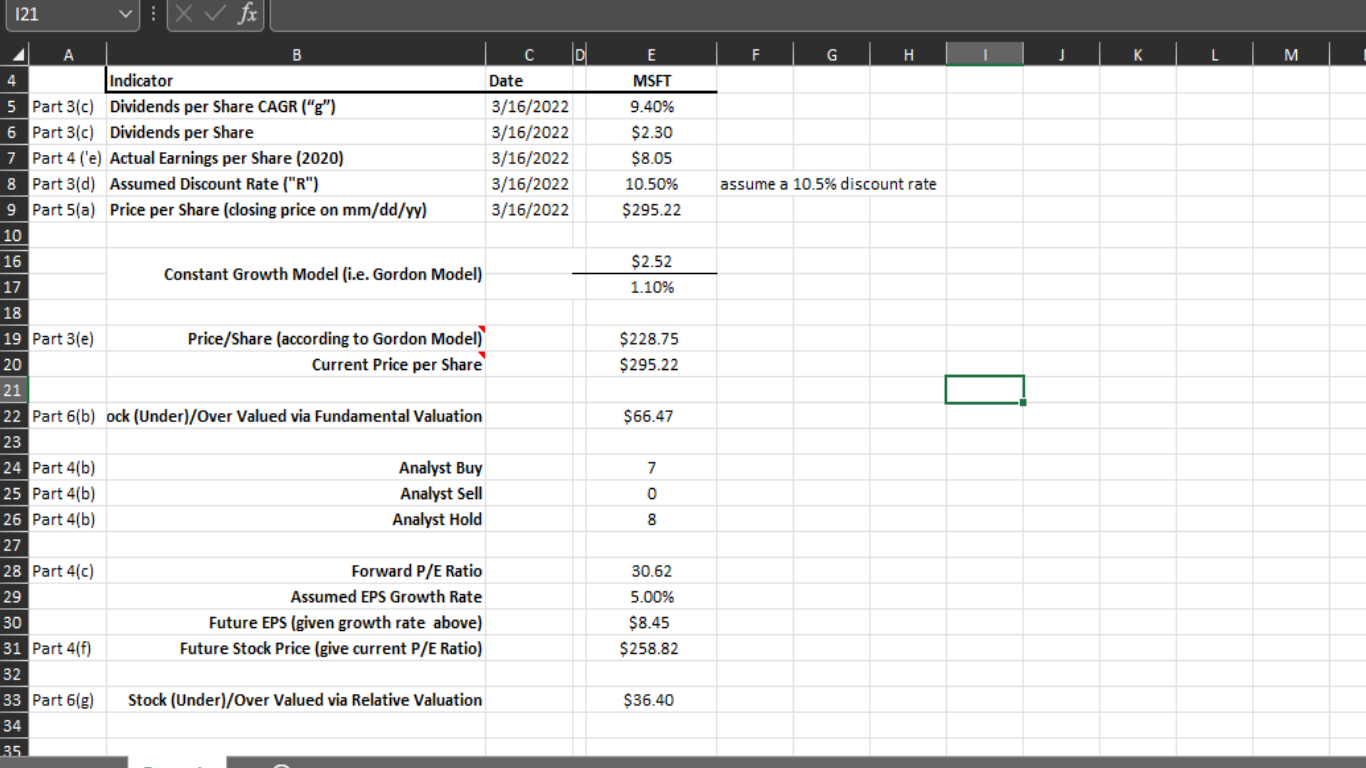
121 # X fx F G H . 1 J K L M A B 4 Indicator 5 Part 3(c) Dividends per Share CAGR ("g") 6 Part 3(c) Dividends per Share 7 Part 4 (e) Actual Earnings per Share (2020) 8 Part 3(d) Assumed Discount Rate ("R") 9 Part 5(a) Price per Share (closing price on mm/dd/yy) 10 C C D Date 3/16/2022 3/16/2022 3/16/2022 3/16/2022 3/16/2022 E MSFT 9.40% $2.30 $8.05 10.50% $295.22 assume a 10.5% discount rate 16 Constant Growth Model (i.e. Gordon Model) $2.52 1.10% 17 $228.75 $295.22 $66.47 7 O 00 8 18 19 Part 3(e) Price/Share (according to Gordon Model) 20 Current Price per Share 21 22 Part 6(b) ock (Under/Over Valued via Fundamental Valuation 23 24 Part 4(b) Analyst Buy 25 Part 4(b) Analyst Sell 26 Part 4(b) Analyst Hold 27 28 Part 4(c) Forward P/E Ratio 29 Assumed EPS Growth Rate 30 Future EPS (given growth rate above) 31 Part 4(f) Future Stock Price (give current P/E Ratio) 32 33 Part 6(g) Stock (Under/Over Valued via Relative Valuation 34 35 30.62 5.00% $8.45 $258.82 $36.40 121 # X fx F G H . 1 J K L M A B 4 Indicator 5 Part 3(c) Dividends per Share CAGR ("g") 6 Part 3(c) Dividends per Share 7 Part 4 (e) Actual Earnings per Share (2020) 8 Part 3(d) Assumed Discount Rate ("R") 9 Part 5(a) Price per Share (closing price on mm/dd/yy) 10 C C D Date 3/16/2022 3/16/2022 3/16/2022 3/16/2022 3/16/2022 E MSFT 9.40% $2.30 $8.05 10.50% $295.22 assume a 10.5% discount rate 16 Constant Growth Model (i.e. Gordon Model) $2.52 1.10% 17 $228.75 $295.22 $66.47 7 O 00 8 18 19 Part 3(e) Price/Share (according to Gordon Model) 20 Current Price per Share 21 22 Part 6(b) ock (Under/Over Valued via Fundamental Valuation 23 24 Part 4(b) Analyst Buy 25 Part 4(b) Analyst Sell 26 Part 4(b) Analyst Hold 27 28 Part 4(c) Forward P/E Ratio 29 Assumed EPS Growth Rate 30 Future EPS (given growth rate above) 31 Part 4(f) Future Stock Price (give current P/E Ratio) 32 33 Part 6(g) Stock (Under/Over Valued via Relative Valuation 34 35 30.62 5.00% $8.45 $258.82 $36.40
Step by Step Solution
There are 3 Steps involved in it

Get step-by-step solutions from verified subject matter experts