

Question: Using the excel table given, I need help answering the following questions. Thanks! How would you describe the shape of the yield curve you created
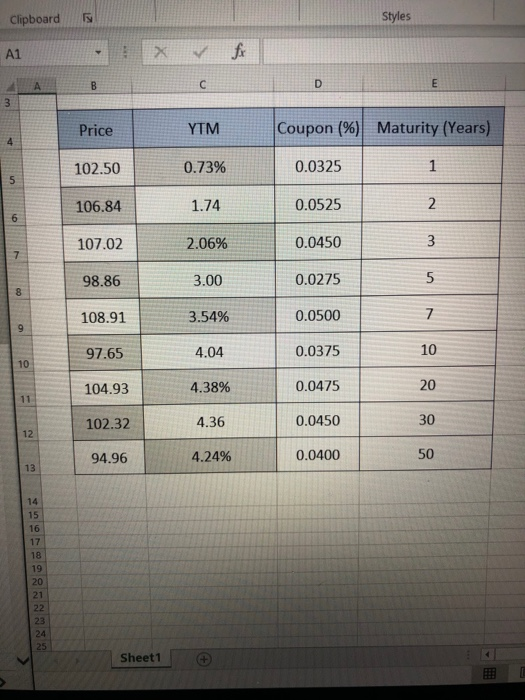
Clipboard Styles A1 X fi A B D E 3 Price YTM Coupon (%) Maturity (Years) 4 102.50 0.73% 0.0325 1 5 106.84 1.74 0.0525 2 6 107.02 2.06% 0.0450 3 7 98.86 3.00 0.0275 8 5 7 108.91 3.54% 0.0500 9 97.65 4.04 0.0375 10 10 104.93 4.38% 0.0475 20 11 102.32 4.36 0.0450 30 12 94.96 4.24% 0.0400 50 13 14 15 16 17 18 19 20 21 22 23 24 25 Sheet1 Clipboard Styles A1 X fi A B D E 3 Price YTM Coupon (%) Maturity (Years) 4 102.50 0.73% 0.0325 1 5 106.84 1.74 0.0525 2 6 107.02 2.06% 0.0450 3 7 98.86 3.00 0.0275 8 5 7 108.91 3.54% 0.0500 9 97.65 4.04 0.0375 10 10 104.93 4.38% 0.0475 20 11 102.32 4.36 0.0450 30 12 94.96 4.24% 0.0400 50 13 14 15 16 17 18 19 20 21 22 23 24 25 Sheet1
Step by Step Solution
There are 3 Steps involved in it

Get step-by-step solutions from verified subject matter experts