

Question: Using the factor beta estimates in Table 1 shown here, EEB, and the expected return estimates in Table 2 shown here, EEB, calculate the risk
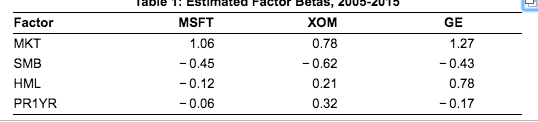
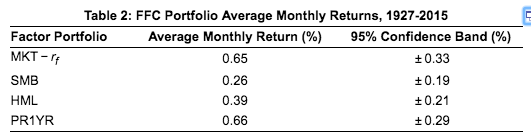
Using the factor beta estimates in Table 1 shown here, EEB, and the expected return estimates in Table 2 shown here, EEB, calculate the risk premium of General Electric stock (ticker: GE) using the FFC factor specification. (Annualize your result by multiplying by 12.) GE's CAPM beta over the same time period was 1.48. How does the risk premium compare with the risk premium you would estimate from the CAPM? The monthly nsk premium of General Electric stock is %. (Round to three decimal places.) Factor MKT SMB HML PR1YR MSFT 1.06 - 0.45 -0.12 -0.06 XOM 0.78 - 0.62 0.21 0.32 GE 1.27 4 -0.43 0.78 Table 2: FFC Portfolio Average Monthly Returns, 1927-2015 Factor Portfolio MKT - rf SMB HML PR1YR Average Monthly Return (%) 0.65 0.26 0.39 0.66 95% Confidence Band (%) +0.33 +0.19 +0.21 t0.29 Using the factor beta estimates in Table 1 shown here, EEB, and the expected return estimates in Table 2 shown here, EEB, calculate the risk premium of General Electric stock (ticker: GE) using the FFC factor specification. (Annualize your result by multiplying by 12.) GE's CAPM beta over the same time period was 1.48. How does the risk premium compare with the risk premium you would estimate from the CAPM? The monthly nsk premium of General Electric stock is %. (Round to three decimal places.) Factor MKT SMB HML PR1YR MSFT 1.06 - 0.45 -0.12 -0.06 XOM 0.78 - 0.62 0.21 0.32 GE 1.27 4 -0.43 0.78 Table 2: FFC Portfolio Average Monthly Returns, 1927-2015 Factor Portfolio MKT - rf SMB HML PR1YR Average Monthly Return (%) 0.65 0.26 0.39 0.66 95% Confidence Band (%) +0.33 +0.19 +0.21 t0.29
Step by Step Solution
There are 3 Steps involved in it

Get step-by-step solutions from verified subject matter experts