

Question: Using the factor beta estimates in the table shown here, B, and the monthly expected return estimates in Table 13.1, EB , calculate the risk
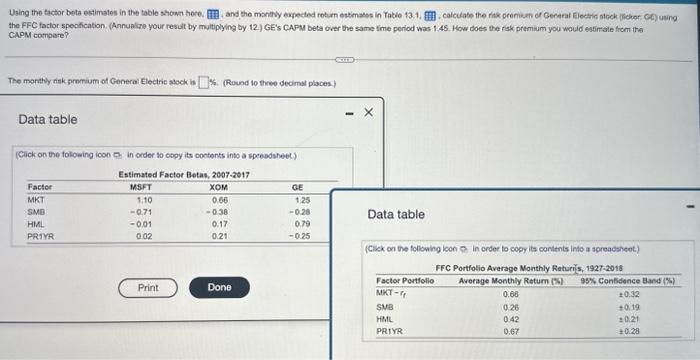
Using the factor beta estimates in the table shown here, B, and the monthly expected return estimates in Table 13.1, EB , calculate the risk premium of General Electric stock (ticker: GE) using
the FFC factor specification. (Annualize your result by multiplying by 12.) GE's CAPM beta over the same time period was 1.45. How does the risk premium you would estimate from the
CAPM compare?
The monthly risk premium of General Electric stock is %. (Round to three decimal places.)
Data table
(Click on the following icon = in order to copy its contents into a spreadsheet.)
Factor
MKT
SMB
HML
PR1VR
Estimated Factor Betas. 2007-2017
MSFT
XO
1.10
0 66
- 071
- 0.38
-001
0.17
0 02
0 21
GE
1 25
- 0.28
0.79
-025
Data table
(Click on the following icon in order to copy its contents into a spreadsheet.)
FC Portfolio Average Monthlv Returns, 1927-2018
Factor Portfolio
Average Monthlv Return (%)
95% Confidence Band (%)
MKT-re
0.66
+ 0.32
SMR
026
HMI
0 1?
+0.19
+021
PR1VR
~ 67
+ 028
the FFC factor specfication. (Annualine your result by multiplying by 12) GE's CAPM beta over the same fime period was 1.45. How does the risk premium you would eatimale frem the CAPM compare? The morthly risk promium of Genera: Electrie stock is 16. (Round to three decimas places) Data table [Click on the following icon in order to copy its contents ints a speesdanet)] Data table (Click on the following licon o in crder to copy its conitents into a spreacsheot)
Step by Step Solution
There are 3 Steps involved in it
1 Expert Approved Answer
Step: 1 Unlock

Question Has Been Solved by an Expert!
Get step-by-step solutions from verified subject matter experts
Step: 2 Unlock
Step: 3 Unlock