

Question: Using the figures below, explain the trends for each angle of attack (that are shown) as the flap deflection angle changes in Figure 1. Use
Figure 1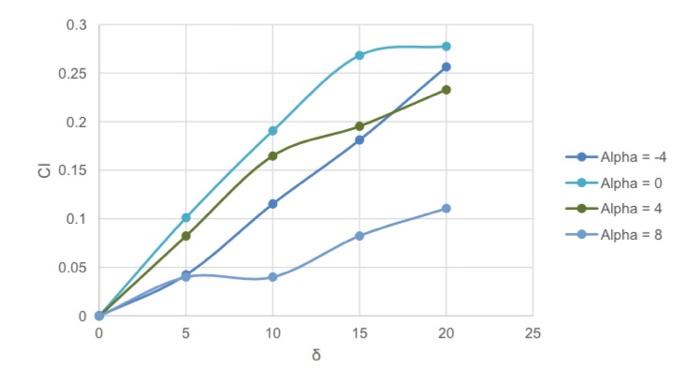
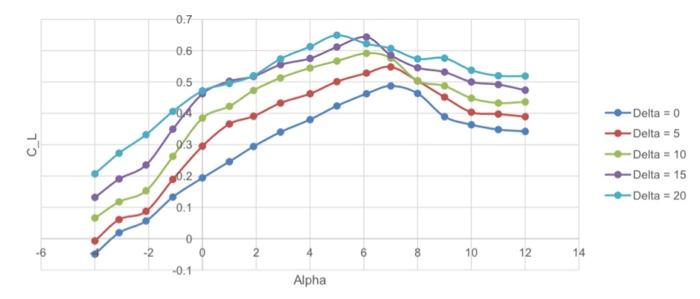
Figure 2
0.3 0.25 0.2 Alpha = -4 J 0.15 Alpha = 0 - Alpha = 4 - Alpha = 8 0.1 0.05 5 10 15 20 25
Step by Step Solution
★★★★★
3.44 Rating (167 Votes )
There are 3 Steps involved in it
1 Expert Approved Answer
Step: 1 Unlock

We my nte frm the given lts tht there re 5 vlues f delt fr whih the fl detet... View full answer
Question Has Been Solved by an Expert!
Get step-by-step solutions from verified subject matter experts
Step: 2 Unlock
Step: 3 Unlock