

Question: Using the figures in the table in Q1 as a baseline, work out an expression for Present Worth with real discount rate, assessment period, salvage
Using the figures in the table in Q1 as a baseline, work out an expression for Present Worth with real discount rate, assessment period, salvage value, and electricity price as independent variables. Then changing just one variable at a time (other things being kept equal) plot graphs of Present Worth versus each of these variables. Use a range of assessment periods up to the lifetime of the technology. Explore the effects of both positive and negative salvage values. On the basis of these graphs and the lectures presented, critically discuss the relative influence of these variables on Present Worth, and hence the more general implications for the economic assessment of renewable energy technologies. You may wish to relate variations in electricity price to carbon pricing. 300 words minimum. Note: to simplify the calculation of present worth, for assessment periods less than the lifetime, neglect the residual value of the technology, and assume salvage values are only incurred at the end of the lifetime of the technology.
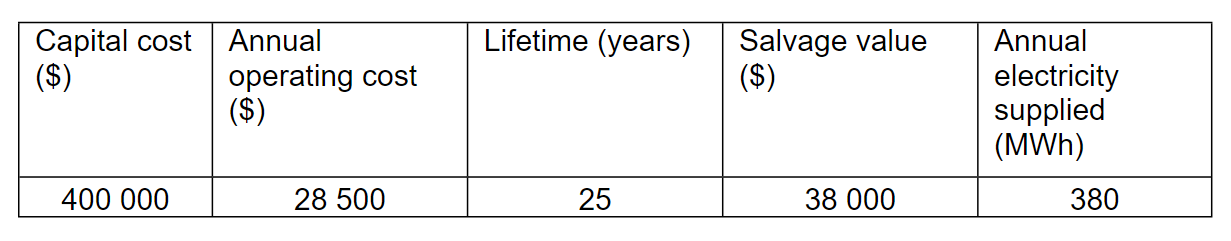
This is the table in Q1
\begin{tabular}{|c|l|c|c|c|} \hline Capitalcost($) & Annualoperatingcost($) & Lifetime (years) & Salvagevalue($) & Annualelectricitysupplied(MWh) \\ \hline 400000 & 28500 & 25 & 38000 & 380 \\ \hline \end{tabular} \begin{tabular}{|c|l|c|c|c|} \hline Capitalcost($) & Annualoperatingcost($) & Lifetime (years) & Salvagevalue($) & Annualelectricitysupplied(MWh) \\ \hline 400000 & 28500 & 25 & 38000 & 380 \\ \hline \end{tabular}
Step by Step Solution
There are 3 Steps involved in it

Get step-by-step solutions from verified subject matter experts