

Question: Using the financial indicators provided below (the table), figure out letters A-H. Please provide a definition for each and also how it relates to the
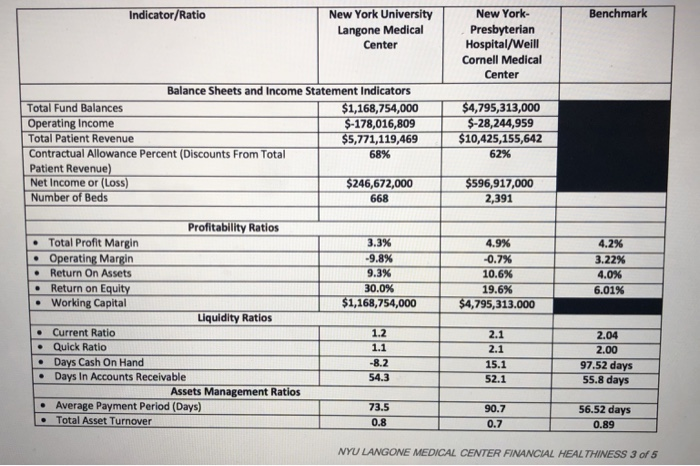
Benchmark New York University Langone Medical Center New York- Presbyterian Hospital/Weill Cornell Medical Center Indicator/Ratio Balance Sheets and Income Statement Indicators $1,168,754,000 $4,795,313,000 Total Fund Balances Operating Income Total Patient Revenue Contractual Allowance Percent (Discounts From Total Patient Revenue) Net Income or (Loss) Number of Beds $-178,016,809 -28,244,959 5,771,119,469 10,425,155,642 62% 68% $246,672,000 $596,917,000 2,391 668 Profitability Ratios Total Profit Margin Operating Margin . Return On Assets 3.3% -9.8% 9.3% 30.0% 42% 3.22% 4,0% 6.01% 4.9% 10.6% 19.6% Return on Equity Working Capital $1,168,754,000 $4,795,313.000 Liquidity Ratios - Current Ratio .Quick Ratio 1.2 1.1 -8.2 54.3 2.1 2.1 15.1 52.1 2.04 2.00 97.52 days 55.8 days Days Cash On Hand . Days In Accounts Receivable Assets Management Ratios Average Payment Period (Days) 73.5 0.8 90.7 0.7 56.52 days 0.89 - Total Asset Turnover NYU LANGONE MEDICAL CENTER FINANCIAL HEAL THINESS 3 of 5
Step by Step Solution
There are 3 Steps involved in it

Get step-by-step solutions from verified subject matter experts