

Question: Using the financial statements available here (a Google sheet) (Links to an external site.)Links to an external site., which of the following comments best describes
Using the financial statements available here (a Google sheet) (Links to an external site.)Links to an external site., which of the following comments best describes (of the three options listed) the results of DuPont analysis on ROE?
A: ROE has grown over three years (to about 12.8% from about 11.50%). This appears to be primarily a result of an increasing asset turnover, which rose to about 1.27 from about 1.06.
B: ROE has grown over three years (to about 12.8% from about 11.50%). This appears to be primarily a result of an increasing net margin, which rose to about 4.8% from about 3.8%.
C: ROE has remained pretty steady over three years, even though the equity multiplier has fallen from about 2.41 in 2016 to about 2.11 in 2018.
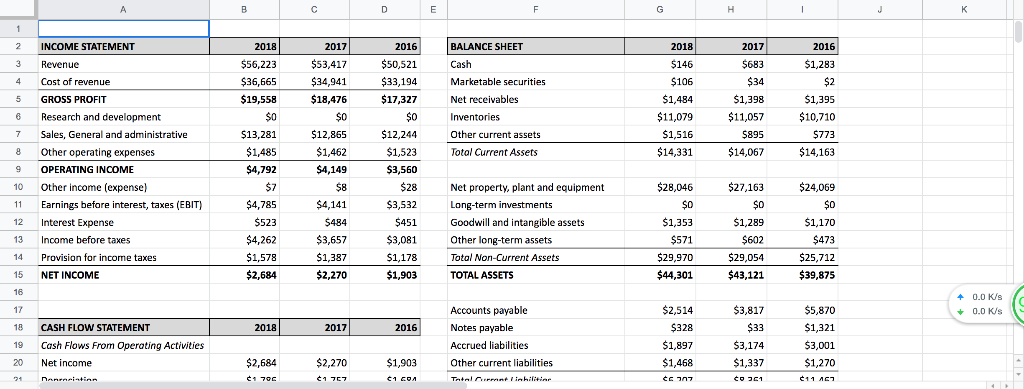
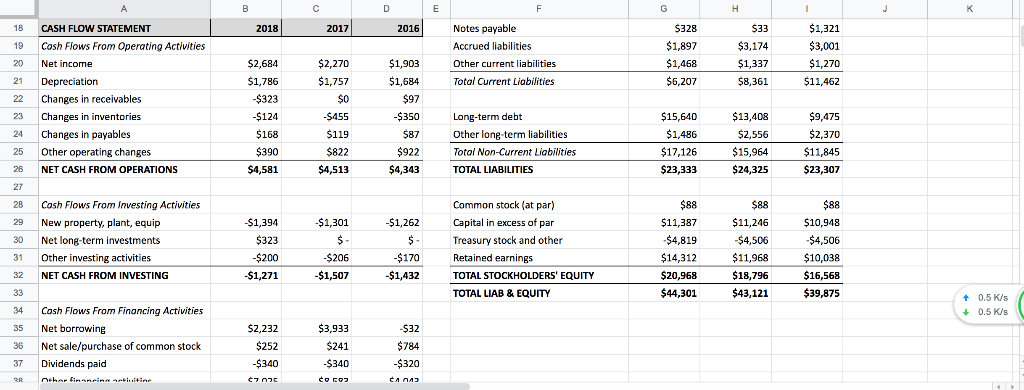
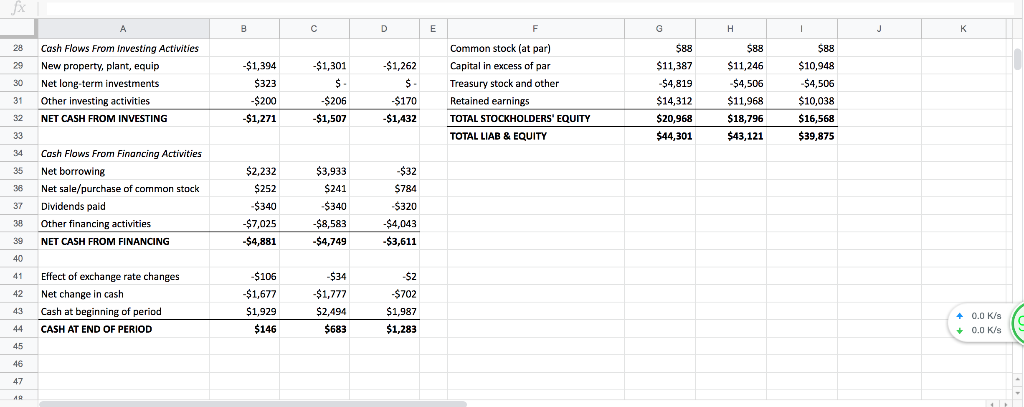
2 INCOME STATEMENT 3 Revenue 4 Cost of revenue 5 GROSS PROFIT 2018 $56,223 $36,665 $19,558 2017 $53,417 $34,941 $18,476 $0 $12,865 $1,462 $4,149 2016 $50,521 33,194 $17,327 BALANCE SHEET Cash Marketable securities Net receivables Inventories Other current assets Total Current Assets 2018 2017 2016 $1,283 $2 $1,395 $10,710 $146 S1,484 $11,079 1,516 $14,331 1,398 $11,057 $895 $14,067 Research and development 12,244 $1,523 $3,560 7 Sales, General and administrative 8 Other operating expenses 9 OPERATING INCOME 10 Other income (expensel 11 Earnings before interest, taxes (EBIT 12 Interest Expense 13 Income before taxes 14 Provision for income taxes 15 NET INCOME 16 $13,281 $1,485 $4,792 $14,163 $28,046 $0 $1,353 $27,.163 $0 $1,289 $602 $29,054 $43,121 $24,069 $0 $1,170 Net property, plant and equipment Long-term investments Goodwill and intangible assets Other long-term assets Total Non-Current Assets TOTAL ASSETS 4,141 $3,532 523 $4,262 1,578 $2,684 $3,657 1,387 $2,270 $3,081 $1,178 $1,903 $29,970 $25,712 $39,875 +0.0 Ks 0.0 K/s $2,514 $328 $1,897 $1,468 Accounts payable $3,817 18 19 20 CASH FLOW STATEMENT Cash Flows From Operating Activities Net income 1,321 $3,001 $1,270 2018 2017 2016 s payable Accrued liabilities 3,174 $1,337 $2,684 $2,270 $1,903 Other current liabilities Notes payable Accrued liabilities Other current liabilitie Total Current Liabilities 5328 $1,897 $1,468 $6,207 $1.321 $3,001 $1,270 $11,462 18 19 20 21 22 23 24 25 26 CASH FLOW STATEMENT Cosh Flows From Operating Activities Net income Depreciation Changes in receivables Changes in inventories Changes in payables Other operating changes NET CASH FROM OPERATIONS 2018 2017 2016 $1,903 $1,684 $3,174 $1,337 $8,361 $2,684 $1,786 $323 $124 $168 270 $1,757 $0 $15,640 $1,486 $17,126 $23,333 350 Long-term debt Other long-term liabilities Total Non-Current Liabilities TOTAL LIABILITIES $13,408 52,556 $15,964 $24,325 475 $2,370 $11,845 $23,307 $119 $922 $4,343 $4,581 28 29 30 31 32 Cash Flows From Investing Activities New property, plant, equip Net long-term investments Other investing activities NET CASH FROM INVESTING $1,394 $323 $200 -$1,271 Common stock (at par) Capital in excess of par Treasury stock and other Retained earnings TOTAL STOCKHOLDERS' EQUITY TOTAL LIAB & EQUITY $88 $11,246 $4,506 $11,968 $18,796 $43,121 1,301 $1,262 $11,387 $4,819 $14,312 $20,968 $10,948 $4,506 $10,038 $16,568 $39,875 $206 $1,507 -$1,432 0.5 K/s 0.5 K/Us 34 Cosh Flows From Financing Activities 35 Net borrowing 3 Net sale/purchase of common stock 37 Dividends paid $2,232 $252 3,933 $241 320 28 Cash Flows From investing Activities 2 New property, plant, equip 30 Net long-term investments 31 Other investing activities 32 NET CASH FROM INVESTING $1,394 323 $200 $1,271 Common stock (at par) Capital in excess of par Treasury stock and other Retained earnings TOTAL STOCKHOLDERS' EQUITY TOTAL LIAB & EQUITY 588 $11,387 $4,819 $14,312 S20,968 $44,301 $88 $11,246 $4,506 $11,968 $18,796 $43,121 $88 $10,948 $4,506 $10,038 $16,568 $39,875 $1,301 $1,262 $206 $1,507 $170 $1,432 34 Cash Flows From Fina 35 Net borrowing 38 Net sale/purchase of common stock 37 Dividends paid 3 Other financing activities 39 NET CASH FROM FINANCING ncing Activities $2,232 S252 $340 $7,025 $4,881 $3,933 $241 $340 $8,583 $4,749 $32 784 $320 $4,043 3,611 41 42 43 44 Effect of exchange rate changes Net change in cash Cash at beginning of period CASH AT END OF PERIOD 106 $1,677 $1,929 $146 534 $1,777 2,494 $683 $702 1,987 $1,283 40.0 K/s 0.0 K/s 46
Step by Step Solution
There are 3 Steps involved in it

Get step-by-step solutions from verified subject matter experts