

Question: Using the following 3 elements from the Strategy Triangle: (1) product-market focus, (2) value proposition and (3) core activities, develop a strategy for Branded Lifestyles
Using the following 3 elements from the Strategy Triangle: (1) product-market focus, (2) value proposition and (3) core activities, develop a strategy for Branded Lifestyles Holdings. For each of the 3 elements of your strategy - justify your decision by explaining how it aligns to the various elements of the Diamond-E framework as applicable.
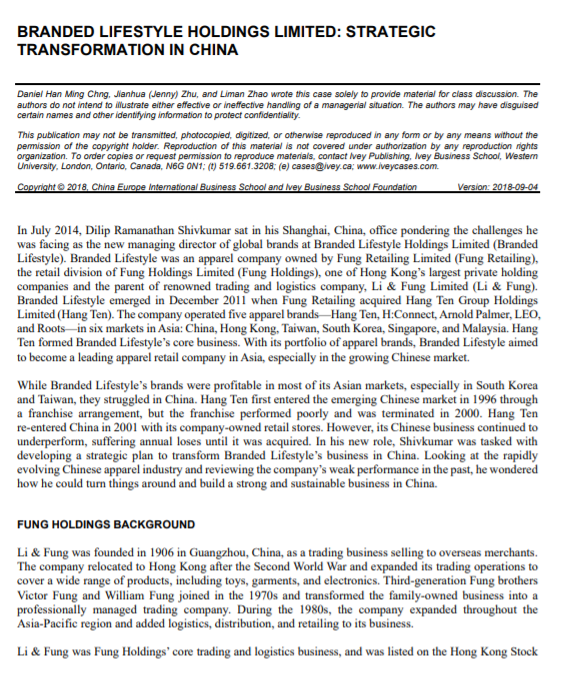
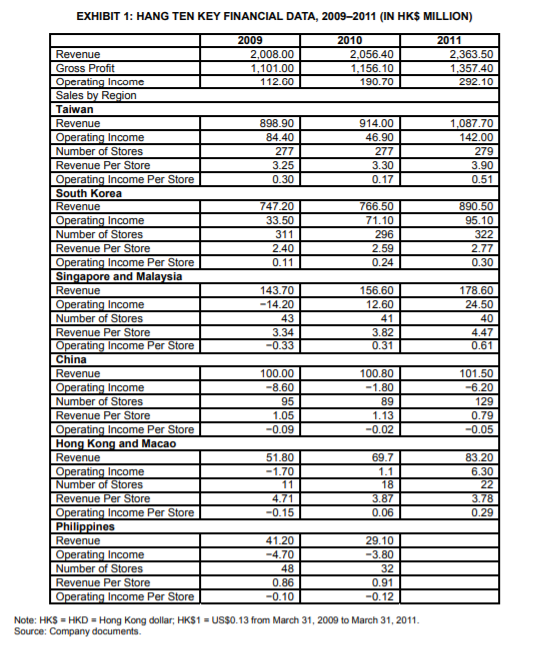
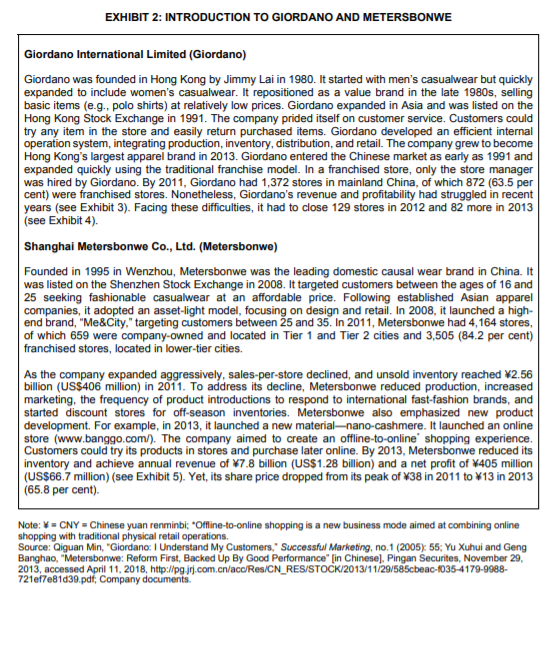
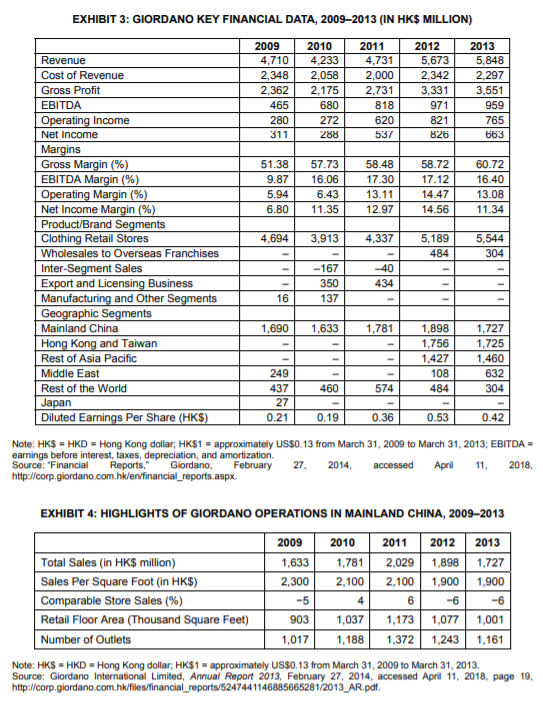
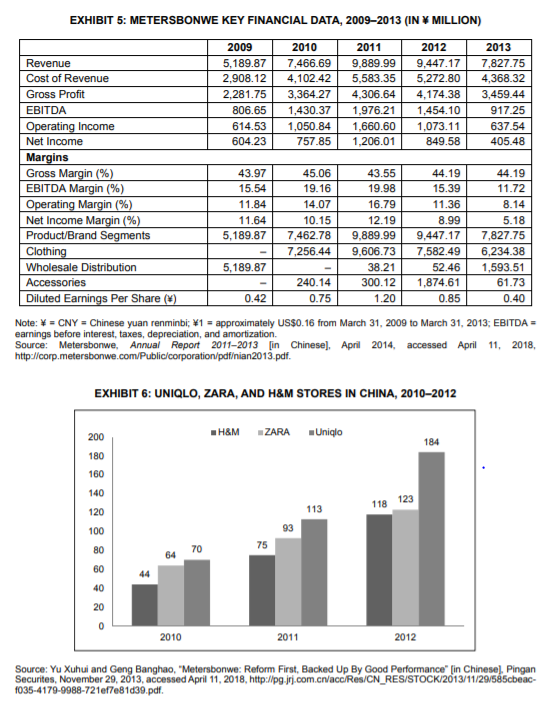
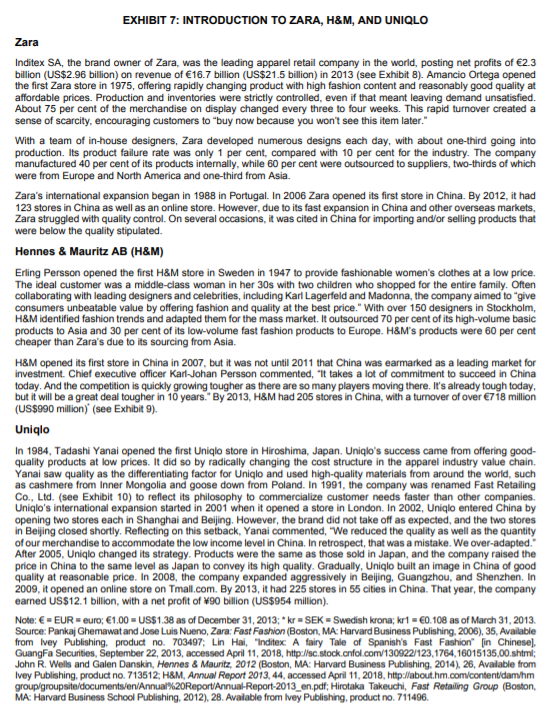
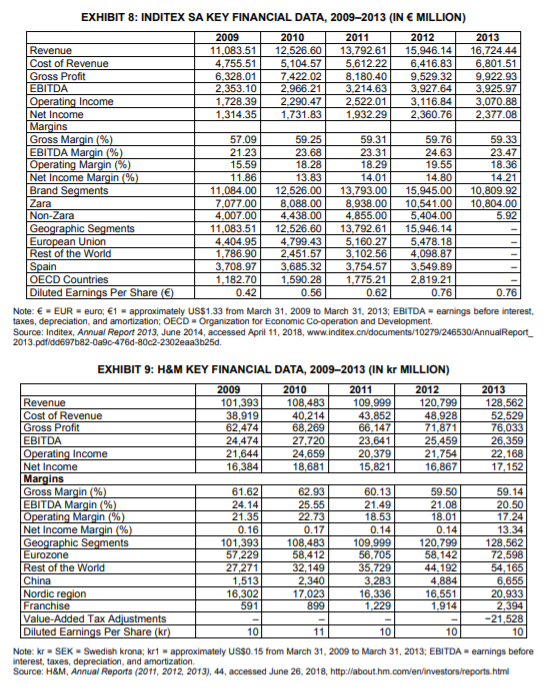
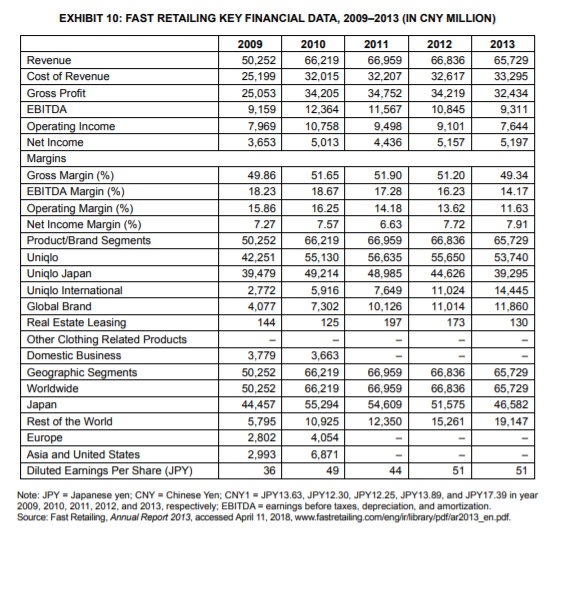
BRANDED LIFESTYLE HOLDINGS LIMITED: STRATEGIC TRANSFORMATION IN CHINA Daniel Han Ming Ching, Jianhua (Jenny) Zhu, and Liman Zhao wrote this case solely to provide material for class discussion. The authors do not intend to illustrate either effective or ineffective handling of a managerial situation. The authors may have disguised certain names and other identifying information to protect confidentiality. This publication may not be transmitted, photocopied, digitized, or otherwise reproduced in any form or by any means without the permission of the copyright holder. Reproduction of this material is not covered under authorization by any reproduction rights organization. To order copies or request permission to reproduce materials, contact Ivey Publishing, Ivey Business School, Western University, London, Ontario, Canada, NGG ON1; (1) 519.661.3208; (e) cases@ivey.ca; www.iveycases.com. Copyright @ 2018, China Europe International Business School and Ivey Business School Foundation Version: 2018-09-04 In July 2014, Dilip Ramanathan Shivkumar sat in his Shanghai, China, office pondering the challenges he was facing as the new managing director of global brands at Branded Lifestyle Holdings Limited (Branded Lifestyle). Branded Lifestyle was an apparel company owned by Fung Retailing Limited (Fung Retailing), the retail division of Fung Holdings Limited (Fung Holdings), one of Hong Kong's largest private holding companies and the parent of renowned trading and logistics company, Li & Fung Limited (Li & Fung). Branded Lifestyle emerged in December 2011 when Fung Retailing acquired Hang Ten Group Holdings Limited (Hang Ten). The company operated five apparel brands-Hang Ten, H: Connect, Arnold Palmer, LEO, and Roots-in six markets in Asia: China, Hong Kong, Taiwan, South Korea, Singapore, and Malaysia. Hang Ten formed Branded Lifestyle's core business. With its portfolio of apparel brands, Branded Lifestyle aimed to become a leading apparel retail company in Asia, especially in the growing Chinese market. While Branded Lifestyle's brands were profitable in most of its Asian markets, especially in South Korea and Taiwan, they struggled in China. Hang Ten first entered the emerging Chinese market in 1996 through a franchise arrangement, but the franchise performed poorly and was terminated in 2000. Hang Ten re-entered China in 2001 with its company-owned retail stores. However, its Chinese business continued to underperform, suffering annual loses until it was acquired. In his new role, Shivkumar was tasked with developing a strategic plan to transform Branded Lifestyle's business in China. Looking at the rapidly evolving Chinese apparel industry and reviewing the company's weak performance in the past, he wondered how he could turn things around and build a strong and sustainable business in China. FUNG HOLDINGS BACKGROUND Li & Fung was founded in 1906 in Guangzhou, China, as a trading business selling to overseas merchants. The company relocated to Hong Kong after the Second World War and expanded its trading operations to cover a wide range of products, including toys, garments, and electronics. Third-generation Fung brothers Victor Fung and William Fung joined in the 1970s and transformed the family-owned business into a professionally managed trading company. During the 1980s, the company expanded throughout the Asia-Pacific region and added logistics, distribution, and retailing to its business. Li & Fung was Fung Holdings' core trading and logistics business, and was listed on the Hong Kong Stock\f\f\f\fEXHIBIT 7: INTRODUCTION TO ZARA, H&M, AND UNIQLO Zara Inditex SA, the brand owner of Zara, was the leading apparel retail company in the world, posting net profits of 62.3 billion (US$2.96 billion) on revenue of (16.7 billion (US$21.5 billion) in 2013 (see Exhibit 8). Amancio Ortega opened the first Zara store in 1975, offering rapidly changing product with high fashion content and reasonably good quality at affordable prices. Production and inventories were strictly controlled, even if that meant leaving demand unsatisfied. About 75 per cent of the merchandise on display changed every three to four weeks. This rapid turnover created a sense of scarcity, encouraging customers to "buy now because you won't see this item later." With a team of in-house designers, Zara developed numerous designs each day, with about one-third going into production. Its product failure rate was only 1 per cent, compared with 10 per cent for the industry. The company manufactured 40 per cent of its products internally, while 60 per cent were outsourced to suppliers, two-thirds of which were from Europe and North America and one-third from Asia. Zara's international expansion began in 1988 in Portugal. In 2006 Zara opened its first store in China. By 2012, it had 123 stores in China as well as an online store. However, due to its fast expansion in China and other overseas markets, Zara struggled with quality control. On several occasions, it was cited in China for importing and/or selling products that were below the quality stipulated. Hennes & Mauritz AB (H&M) Erling Persson opened the first H&M store in Sweden in 1947 to provide fashionable women's clothes at a low price. The ideal customer was a middle-class woman in her 30s with two children who shopped for the entire family. Often collaborating with leading designers and celebrities, including Karl Lagerfeld and Madonna, the company aimed to *give consumers unbeatable value by offering fashion and quality at the best price." With over 150 designers in Stockholm, H&M identified fashion trends and adapted them for the mass market. It outsourced 70 per cent of its high-volume basic products to Asia and 30 per cent of its low-volume fast fashion products to Europe. H&M's products were 60 per cent cheaper than Zara's due to its sourcing from Asia. H&M opened its first store in China in 2007, but it was not until 2011 that China was earmarked as a leading market for investment. Chief executive officer Karl-Johan Persson commented, "It takes a lot of commitment to succeed in China today. And the competition is quickly growing tougher as there are so many players moving there. It's already tough today, but it will be a great deal tougher in 10 years." By 2013, H&M had 205 stores in China, with a turnover of over 6718 million (US$990 million)'(see Exhibit 9). Uniqlo In 1984, Tadashi Yanai opened the first Uniqlo store in Hiroshima, Japan. Uniqlo's success came from offering good- quality products at low prices. It did so by radically changing the cost structure in the apparel industry value chain, Yanai saw quality as the differentiating factor for Uniqlo and used high-quality materials from around the world, such as cashmere from Inner Mongolia and goose down from Poland. In 1991, the company was renamed Fast Retailing Co., Lid. (see Exhibit 10) to reflect its philosophy to commercialize customer needs faster than other companies. Uniqlo's international expansion started in 2001 when it opened a store in London. In 2002, Uniqlo entered China by opening two stores each in Shanghai and Beijing. However, the brand did not take off as expected, and the two stores in Beijing closed shortly. Reflecting on this setback, Yanai commented, "We reduced the quality as well as the quantity of our merchandise to accommodate the low income level in China. In retrospect, that was a mistake. We over-adapted." After 2005, Uniqlo changed its strategy. Products were the same as those sold in Japan, and the company raised the price in China to the same level as Japan to convey its high quality. Gradually, Uniqlo built an image in China of good quality at reasonable price. In 2008, the company expanded aggressively in Beijing, Guangzhou, and Shenzhen. In 2009, it opened an online store on Tmall.com. By 2013, it had 225 stores in 55 cities in China. That year, the company earned US$12.1 billion, with a net profit of 190 billion (US$954 million). Note: E = EUR = euro; (1.00 = US$1.38 as of December 31, 2013; * kr = SEK = Swedish krona; kr1 = ED.108 as of March 31, 2013. Source: Pankaj Gherawat and Jose Luis Nueno, Zara: Fast Fashion (Boston, MA: Harvard Business Publishing, 2006), 35, Available from Ivey Publishing, product no. 703497; Lin Hai, "Inditex: A fairy Tale of Spanish's Fast Fashion" [in Chinese] GuangFa Securities, September 22, 2013, accessed April 11, 2018, http:/sc.stock.onfol.com/130922/123,1764, 16015135,00.shiml; John R. Wells and Galen Danskin, Hennes & Mauritz, 2012 (Boston, MA: Harvard Business Publishing, 2014), 26, Available from Ivey Publishing, product no. 713512; H&M, Annual Report 2013, 44, accessed April 11, 2018, http:/about.hm.com/content/dam/hm group/groupsite/documents/en/Annual%20Report/Annual-Report-2013_en.pdf; Hirotaka Takeuchi, Fast Retailing Group (Boston. MA: Harvard Business School Publishing, 2012), 28. Available from Ivey Publishing, product no. 711496.EXHIBIT 8: INDITEX SA KEY FINANCIAL DATA, 2009-2013 (IN E MILLION) 2009 2010 2011 2012 2013 Revenue 11.083.51 12,526.60 13,792.61 15,946.14 6,724.44 Cost of Revenue 4,755.51 5,104.57 5,612.22 6,416.83 6,801.51 Gross Profit 6.328.01 7.422.02 8,180.40 EBITDA 9.529.32 9,922.93 2.353.10 2.966.21 3,214.63 3,927.64 3,925.97 Operating Income 1,728.39 2.290.47 2,522.01 3,116.84 3,070.88 Net Income 1,314.35 1,731.83 1,932.29 2,360.76 2,377.08 Margins Gross Margin (%) 57.09 59.25 59.31 59.76 59.33 EBITDA Margin (%) 21.23 23.68 23.31 24.63 23.47 Operating Margin (%) 15.59 18.28 18.29 19.55 18.36 Net Income Margin (%) 11.86 13.83 14.01 14.80 14.21 Brand Segments 11,084.00 12,526.00 13,793.00 15,945.00 10,809.92 Zara 7.077.00 8.088.00 8,938.00 10,541.00 10,804.00 Non-Zara 4,007.00 4.438.00 4.855.00 5,404.00 5.92 Geographic Segments 11.083.51 12.526.60 13,792.61 15,946.14 European Union 4,404.95 4,799.43 5,160.27 5,478.18 Rest of the World 1,786.90 2.451.57 3,102.56 4,098.87 Spain 3,708.97 3.685.32 3,754.57 3.549.89 OECD Countries 1,182.70 1,590.28 1,775.21 2.819.21 Diluted Earnings Per Share (E 0.42 0.56 0.62 0.76 0.76 Note:
Step by Step Solution
There are 3 Steps involved in it

Get step-by-step solutions from verified subject matter experts