

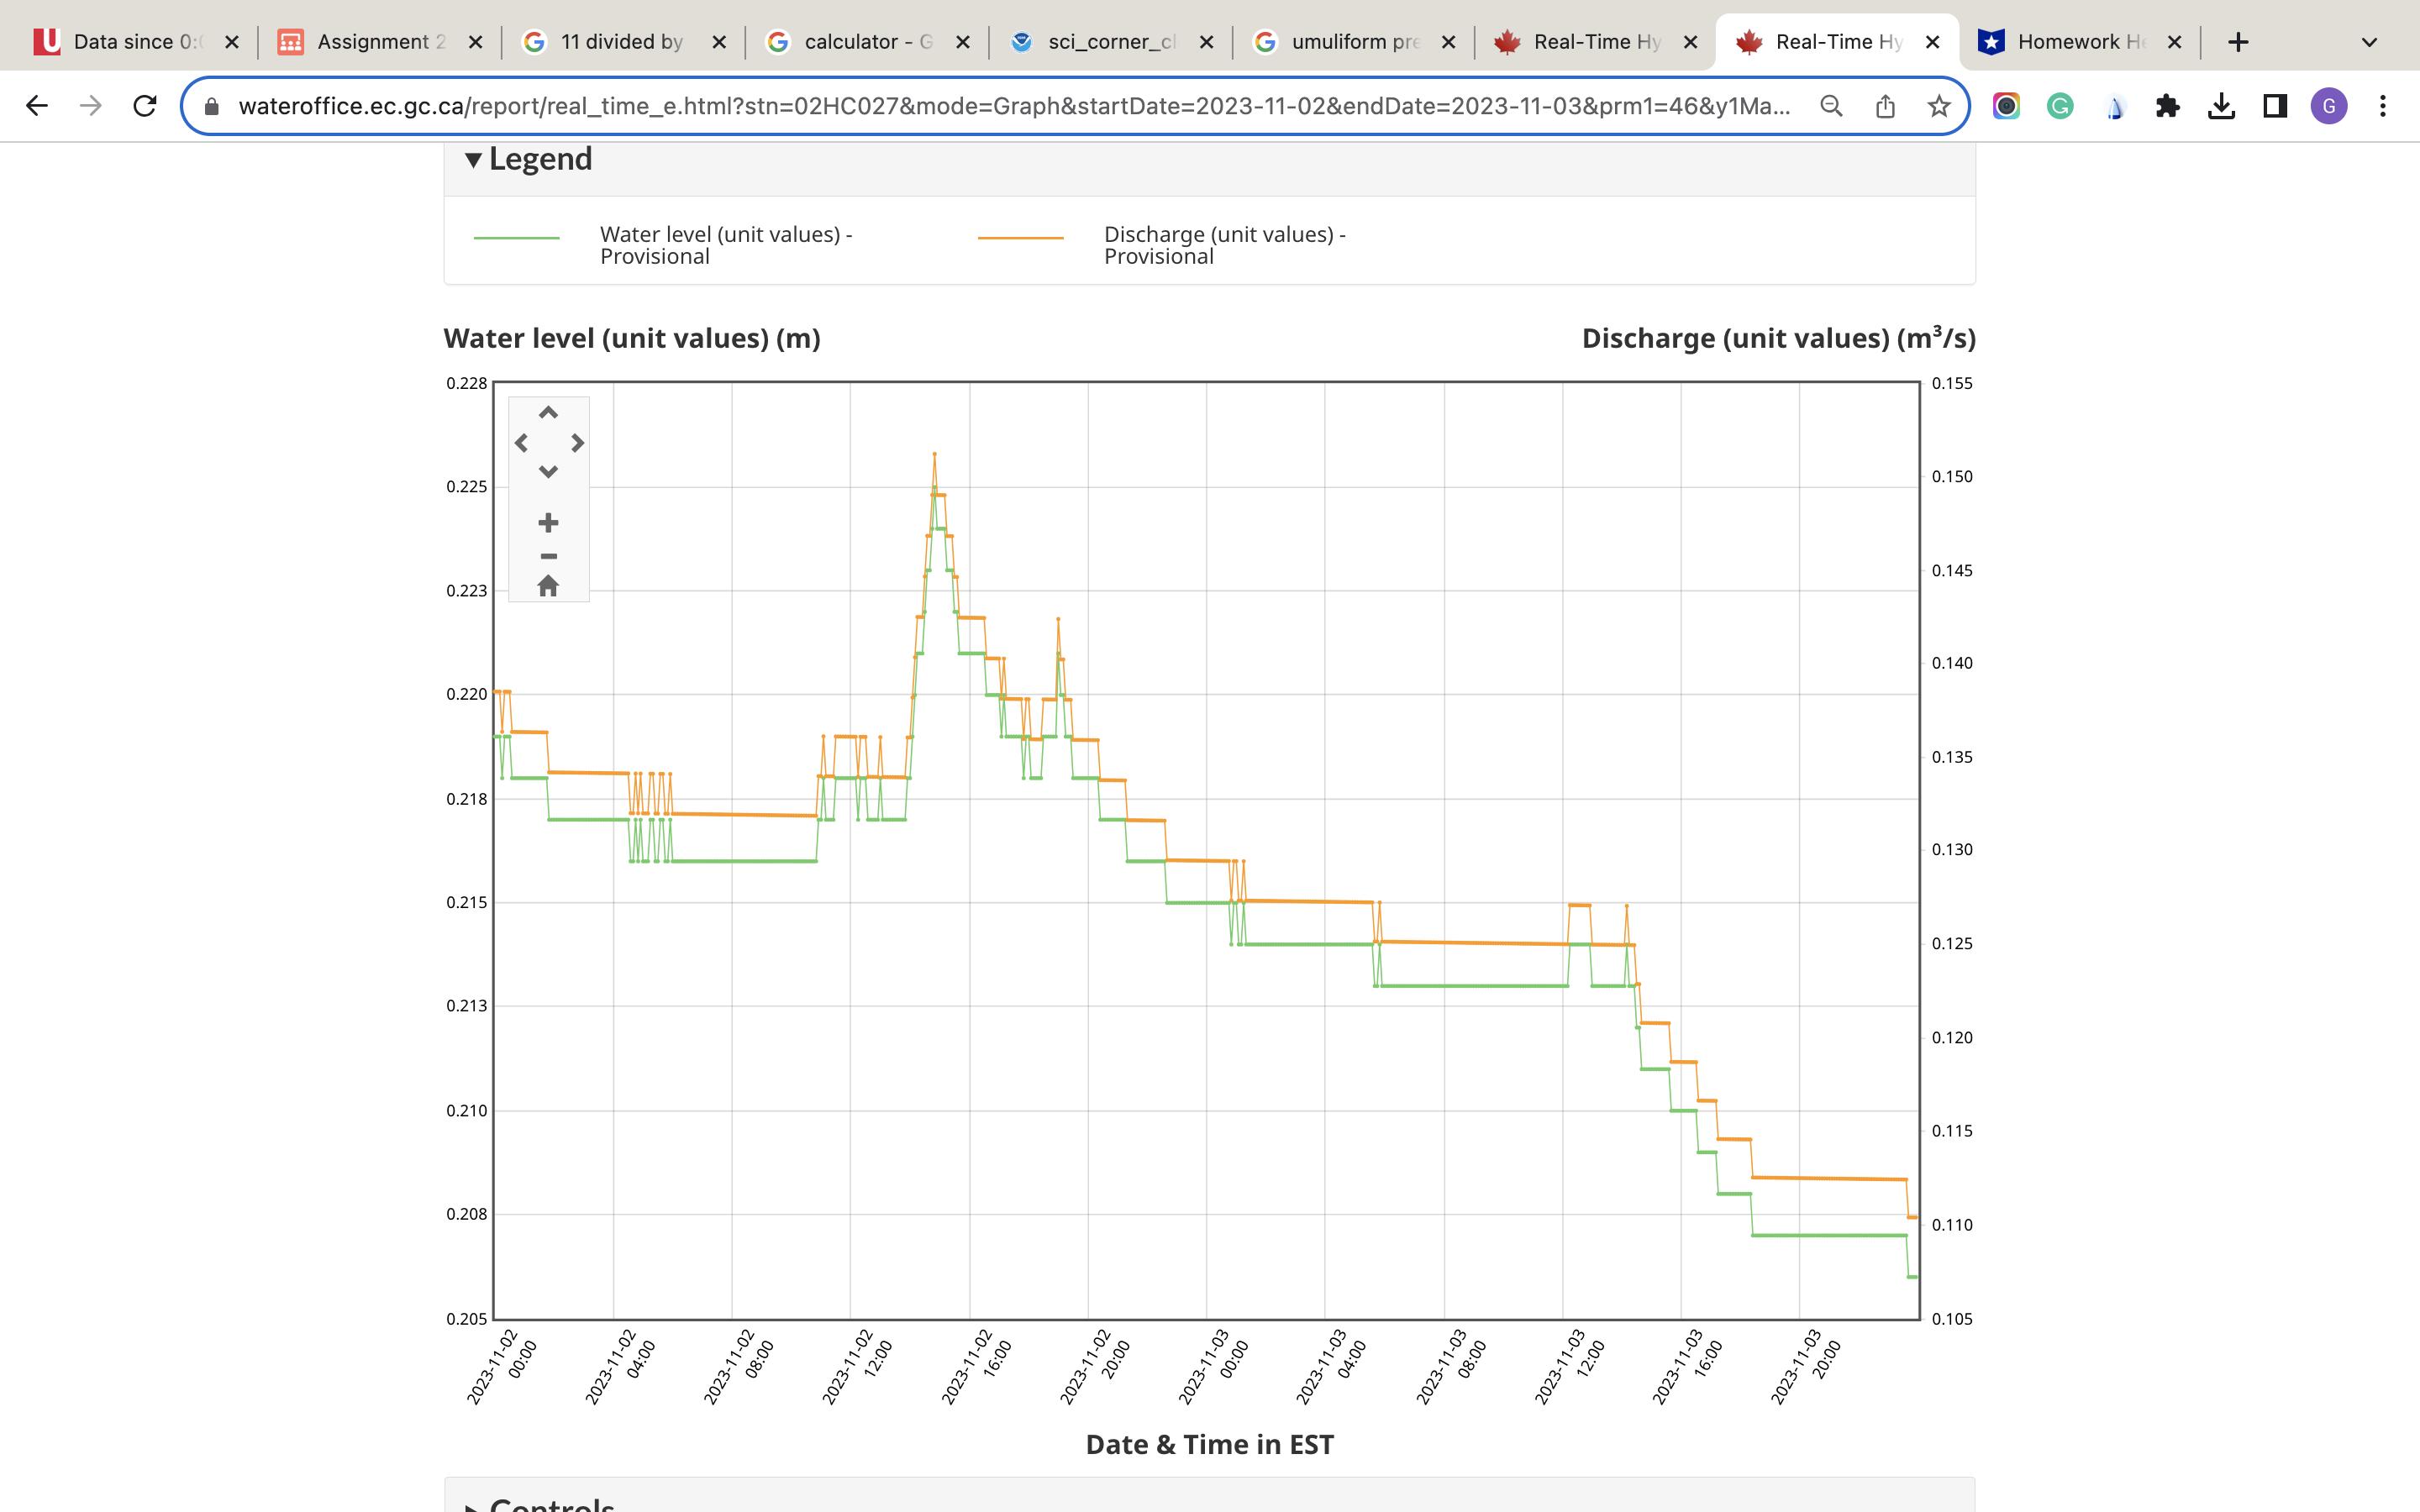
Question: Using the following chart answer the following: Determine the average value for the water level (m) and discharge (m 3 /s). [1 mark] Assuming
Using the following chart answer the following:
- Determine the average value for the water level (m) and discharge (m3/s). [1 mark]
- Assuming that the stream has a semi-circular cross section whose radius is equal to the water level:
- Estimate the corresponding cross-sectional area. [2 marks]
- Using the measured discharge (Question 2(a)(i)) together with the cross-sectional area (Question 2(a)(ii)(1)), estimate the average flow speed of the stream. [3 marks]
- By adjusting the date parameters, ensure hydrometric data is available for the precipitation events identified in Question 1(a). For these events:
- Determine the peak value for the water level (m) and discharge (m3/s) as well as the corresponding time. [1 mark]
- Assuming that the stream has a semi-circular cross section whose radius is equal to the peak value for the water level:
- Estimate the corresponding cross-sectional area. [2 marks]
- Using the measured peak discharge (Question 2(b)(i)) together with the cross-sectional area (Question 2(b)(ii)(1)), estimate the peak flow speed of the stream. [3 marks]
- Provide a screenshot of hydrometric data used - just the graph. [-5 marks for failing to provide the screenshot.]
- Compare average and peak scenarios (for the chosen event) as follows:
- Divide the peak water level by the average water level. [1 mark]
- Divide the peak discharge by the average discharge. [1 mark]
- Divide the peak flow speed by the average flow speed. [1 mark]
- If the stream's kinetic energy is proportional to the square of the flow speed, how much more energetic is the stream at its peak versus the average scenario?
U Data since 0:0 X C Assignment 2 x G 11 divided by X G calculator - G X Legend Water level (unit values) (m) 0.228 wateroffice.ec.gc.ca/report/real_time_e.html?stn=02HC027&mode=Graph&startDate=2023-11-02&endDate=2023-11-03&prm1=46&y1Ma... 0.225 0.223 0.220 0.218 0.215 0.213 0.210 0.208 0.205 - C Water level (unit values) - Provisional 00:00 2023-11-02 Controle 2023-11-02 04:00 2023-11-02 08:00 2023-11-02 12:00 sci_corner_clx Gumuliform pre x 16:00 2023-11-02 Discharge (unit values) - Provisional 20:00 2023-11-02 00:00 2023-11-03 Date & Time in EST 04:00 2023-11-03 Real-Time Hy 2023-11-03 08:00 X 2023-11-03 12:00 Real-Time Hy Discharge (unit values) (m/s) 2023-11-03 16:00 X 2023-11-03 20:00 0.155 0.150 0.145 0.140 0.135 0.130 0.125 0.120 0.115 0.110 0.105 Homework He x + G :
Step by Step Solution
3.47 Rating (157 Votes )
There are 3 Steps involved in it
a Critically damped system The steadystate error for a critically damped system can be calculated us... View full answer

Get step-by-step solutions from verified subject matter experts